Products You May Like
Narrow up and down trading range
The NZDUSD has had an up and down day in a relatively narrow 36 pip trading range (for the day).
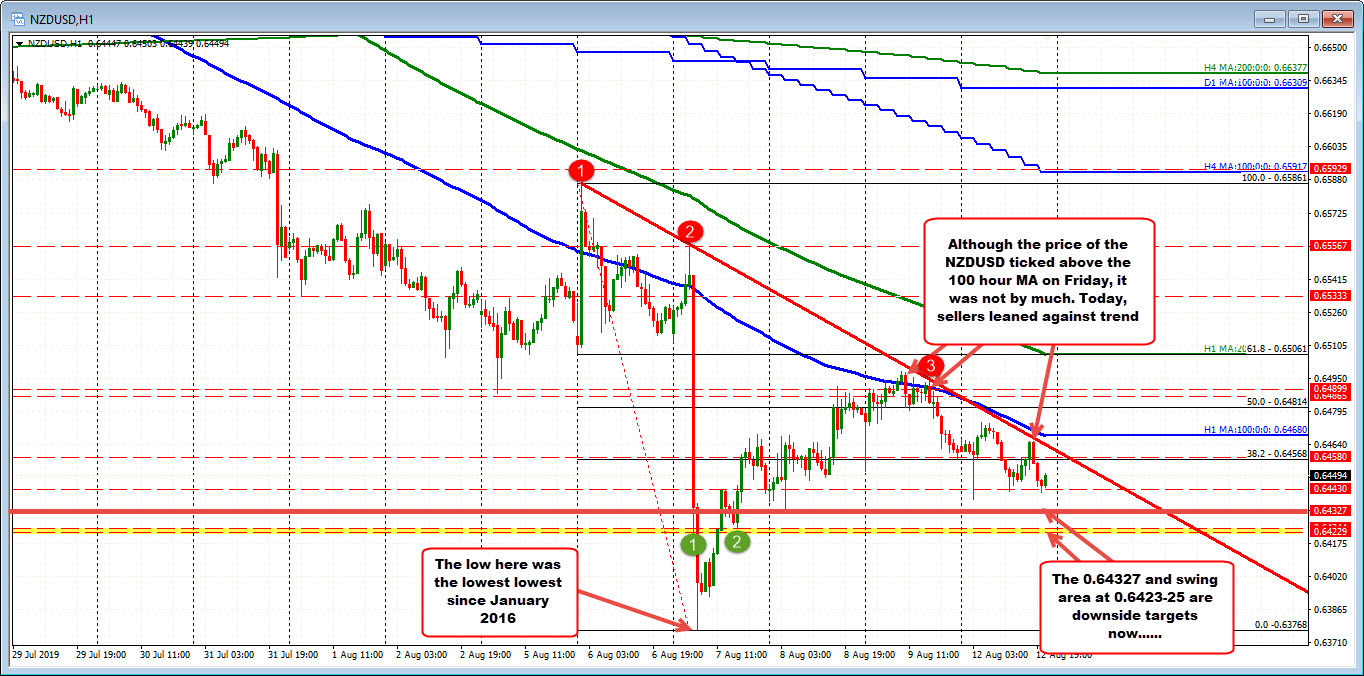
Technically, the “ups” today, were able to stay below a top side trendline, and the 100 hour moving average (blue line in the chart above). That kept the sellers more in control.
The price is back down trading near the lows for the day at 0.6438 (the low just reached 0.64417). A move below the low will have traders targeting 0.6432 low from Thursday and a swing area at 0.6423 – 25. On Wednesday last week, the pair moved to the lowest level since January 2017 at 0.63768. That would be another key target if the sellers can keep control.
With stocks under pressure and tensions rising in Hong Kong, the NZDUSD is lower, but it is not running to the downside. Typically, if there is a “risk off” trade with gold up (it is up about $30 now), US yields lower (30 year down -13 bps), stocks lower (Nasdaq down -1.55%), the NZDUSD and AUDUSD are some of the pairs that get hit. The declines are contained (the price is still low the Asian session low).
Nevertheless stay below the trend line and the 100 hour moving average. does not give the buyers much in the way of technical bullish confidence.