Products You May Like
Gold Talking Points
Gold has finally cleared the range-bound price action from December, with the price for bullion climbing to a fresh yearly-high ($1316) following the Federal Reserve meeting, and the precious metal may continue to catch a bid as it carves a series of higher highs & lows.
Gold Extends Bullish Series as FOMC Defends Larger Balance Sheet

Gold prices appear to be on track to test the May-high ($1326) as the Federal Open Market Committee (FOMC) drops the hawkish forward-guidance for monetary policy, and it seems as though the central bank will continue to change its tune over the coming months as ‘the case for raising rates has weakened somewhat.’
The sudden shift in central bank rhetoric suggests the FOMC will adopt a more cautious tone over the coming months as ‘cross-currents’ cloud the economic outlook, and the committee may continue to tame bets for higher interest rates as ‘inflation readings have been muted.’
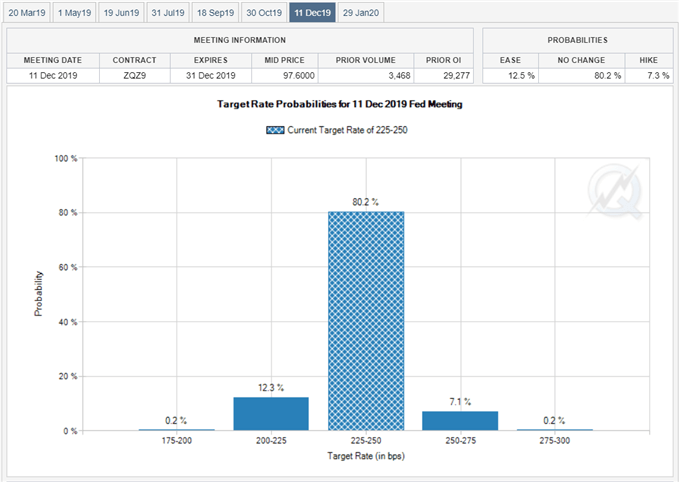
In turn, Fed Fund Futures may persistently show Chairman Jerome Powell and Co. on hold throughout 2019, and it seems as though the Fed will ultimately taper the $50B/month in quantitative tightening (QT) as officials note that ‘the normalization of the size of the portfolio will be completed sooner, and with a larger balance sheet, than in previous estimates.’
Waning expectations for higher U.S. interest rates should continue to heighten the appeal of bullion especially as the FOMC emphasizes that ‘growth has slowed in some major foreign economies,’ and gold may exhibit a more bullish behavior over the near-term as it extends the upward trend carried over from late-2018. Sign up and join DailyFX Currency Analyst David Song LIVE for an opportunity to discuss potential trade setups.
Gold Daily Chart

- The May-high ($1326) sits on the radar for gold as it extends the series of higher highs & lows from earlier this week, with the Relative Strength Index (RSI) also highlighting a constructive outlook as oscillator snaps the bearish formation and pushes into overbought territory.
- Close above the $1315 (23.6% retracement) to $1316 (38.2% expansion) region opens up the Fibonacci overlap around $1328 (50% expansion) to $1329 (50% expansion), with the next hurdle coming in around $1340 (61.8% expansion).
For more in-depth analysis, check out the 1Q 2019 Forecast for Gold
Additional Trading Resources
Are you looking to improve your trading approach? Review the ‘Traits of a Successful Trader’ series on how to effectively use leverage along with other best practices that any trader can follow.
Want to know what other markets the DailyFX team is watching? Download and review the Top Trading Opportunities for 2019.
— Written by David Song, Currency Analyst
Follow me on Twitter at @DavidJSong.