Products You May Like
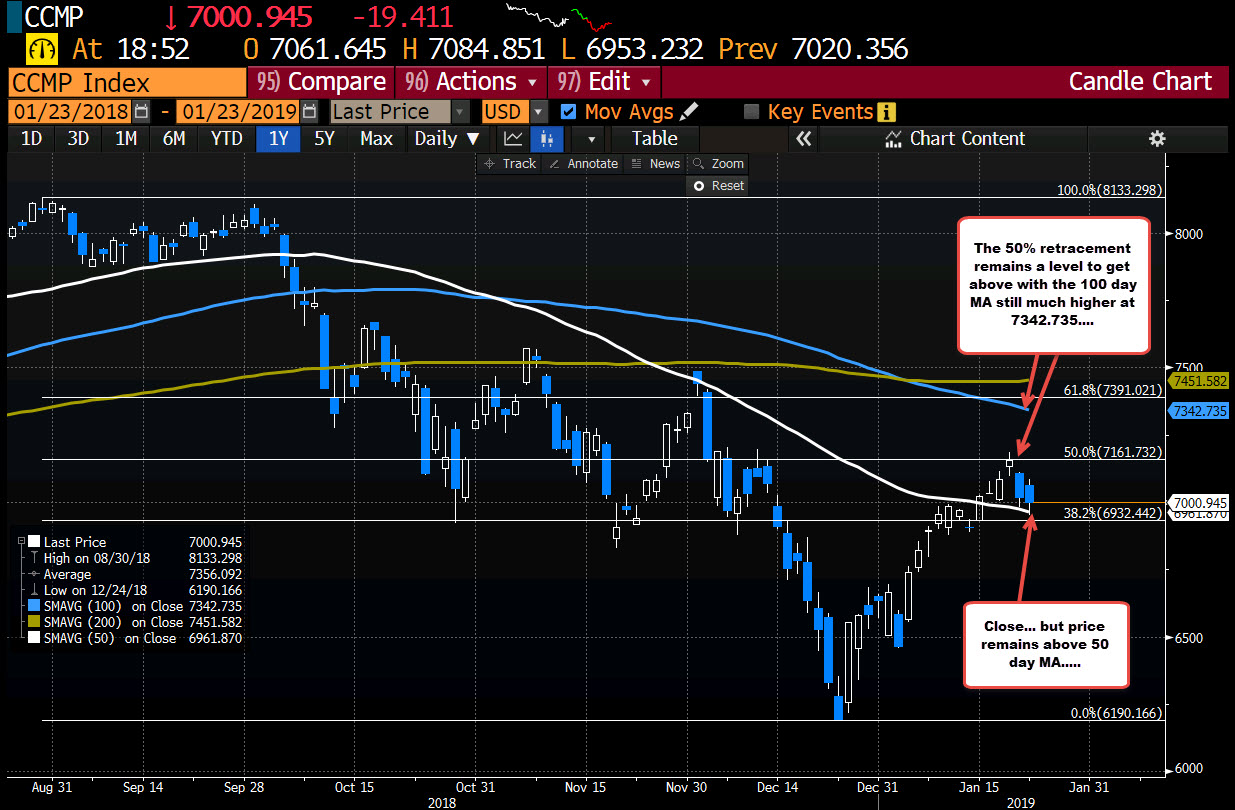
The lows from the last two days stall at the MA level
Phew…
The Nasdaq composite index is still lower on the day, trading down about -9 points currently, but it was worse at the lows. Moreover, the low price stalled just above the 50 day MA. Yesterday that MA was also tested before bouncing late in the day (white line in the chart above).
So traders are keep the buyers in play and a little more in control.
Now all is not all rosy. The high price from Friday’s rise took the price above the 50% of the move down from the end of August 2019 high at 7161.732. That try stalled. The price is also well below the 100 day MA at 7342.735. Bull markets in stocks take the price above that benchmark MA and stay above that key 100 day MA.
The good news is the 50 day MA is holding and hopes for opening governement and progress on US/China trade may keep a bid. The bad news is there is more work to do technically and with fundamentals like US/China, government shutdown. The price action will tell the story. The 50 day MA below, and 50% retracement are the closest levels on the daily chart toeye for trading clues.