Products You May Like
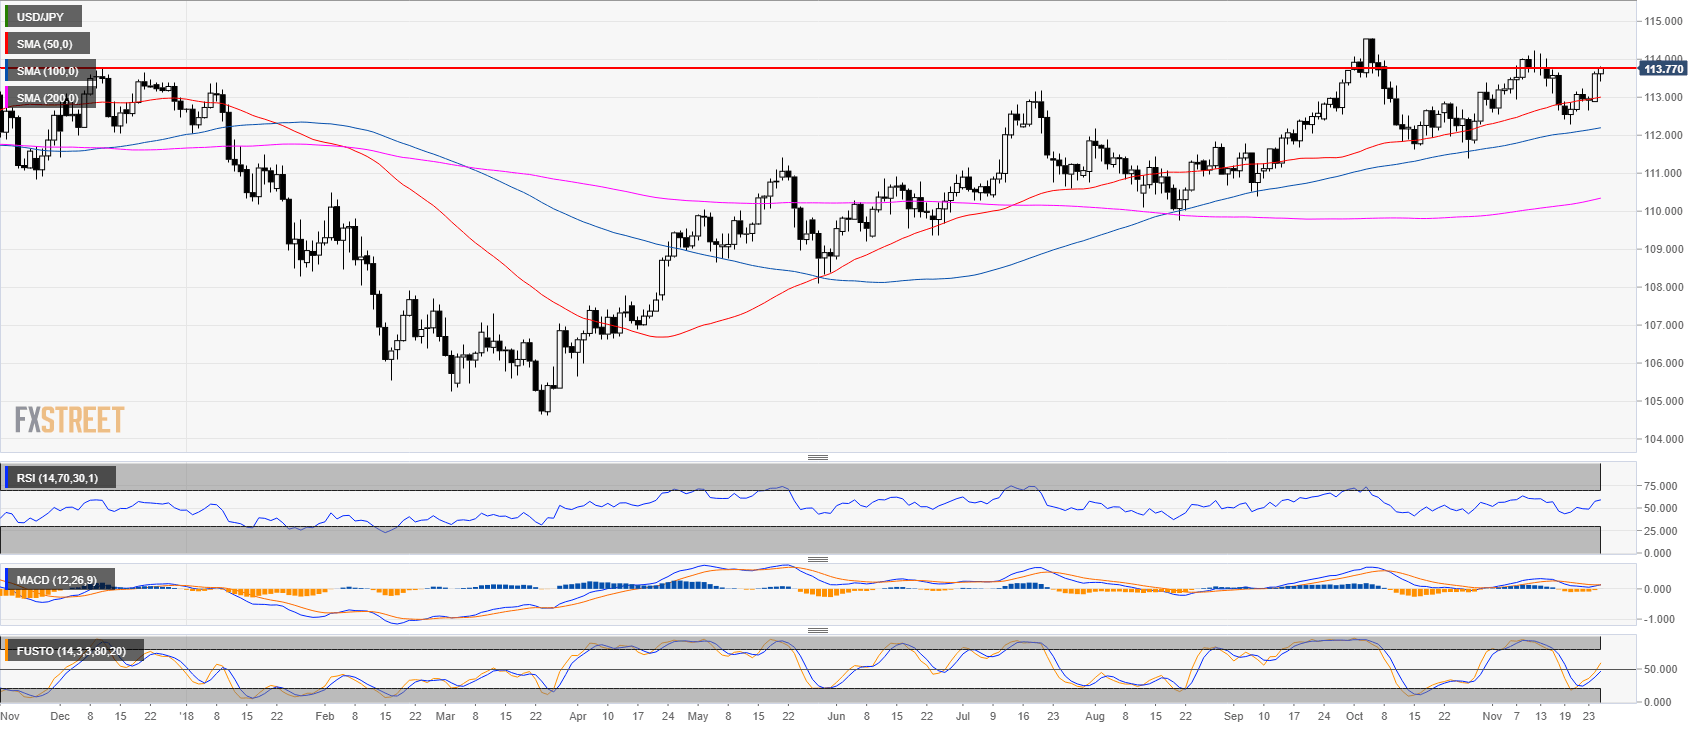
USD/JPY daily chart
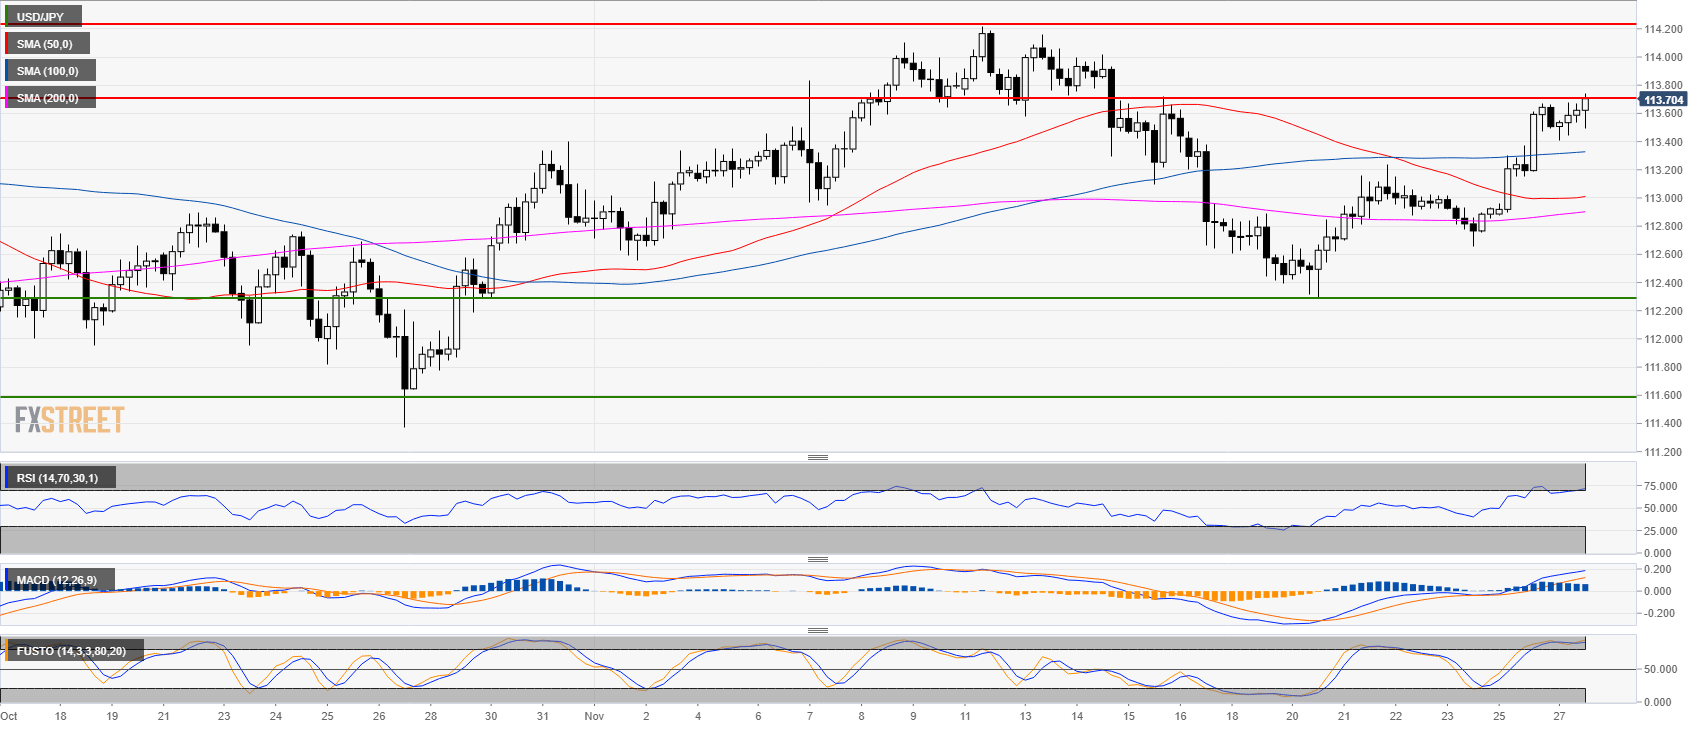
USD/JPY 4-hour chart
- USD/JPY bulls next objective is to reclaim the 114.20 resistance.
- Technical indicators are bullish although in overbought territories.
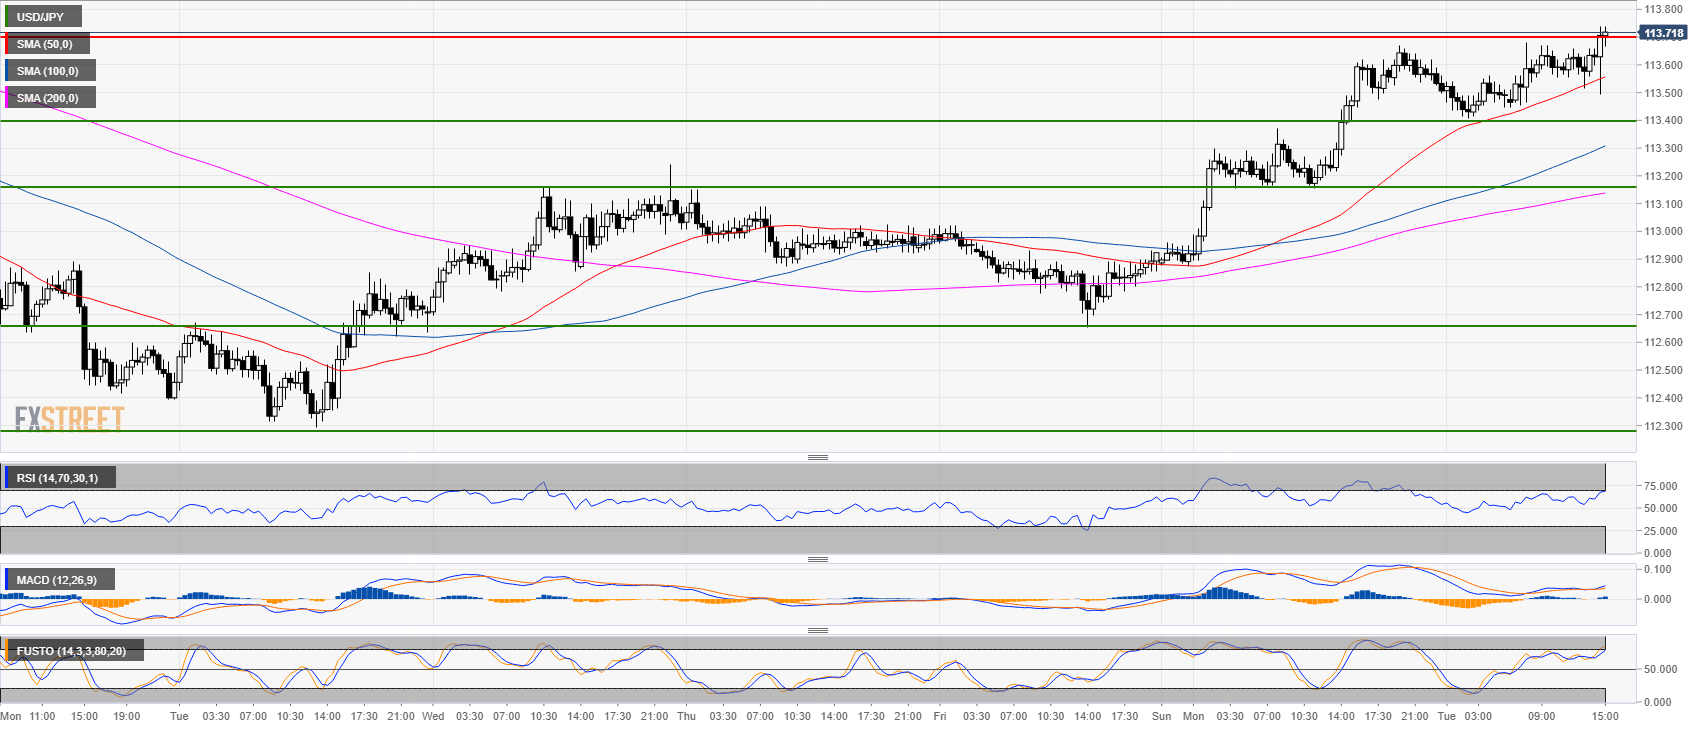
USD/JPY 30-minute chart
- USD/JPY bulls are breaking above the 113.70 resistance.
- The path of least resistance is to the upside as 114.20 should become the next target.
Additional key levels
USD/JPY
Overview:
Today Last Price: 113.78
Today Daily change: 16 pips
Today Daily change %: 0.141%
Today Daily Open: 113.62
Trends:
Previous Daily SMA20: 113.26
Previous Daily SMA50: 112.97
Previous Daily SMA100: 112.17
Previous Daily SMA200: 110.29
Levels:
Previous Daily High: 113.67
Previous Daily Low: 112.88
Previous Weekly High: 113.24
Previous Weekly Low: 112.3
Previous Monthly High: 114.56
Previous Monthly Low: 111.38
Previous Daily Fibonacci 38.2%: 113.37
Previous Daily Fibonacci 61.8%: 113.18
Previous Daily Pivot Point S1: 113.1
Previous Daily Pivot Point S2: 112.59
Previous Daily Pivot Point S3: 112.31
Previous Daily Pivot Point R1: 113.9
Previous Daily Pivot Point R2: 114.18
Previous Daily Pivot Point R3: 114.69


