Products You May Like
GOLD & CRUDE OIL TALKING POINTS:
- Gold prices plunge as US Dollar gains on Italy turmoil, Fed outlook
- Crude oil prices remain stuck at chart resistance below $73/barrel
- US PCE inflation data, EIA monthly output report now focus ahead
Gold prices tumbled as a spirited recovery in the US Dollar undercut the appeal of anti-fiat alternatives. The greenback managed to capitalize on its haven and yield appeal on the same day, initially rising against the backdrop of political turmoil in Italy and continuing higher alongside front-end Treasury yields as markets continued to on-board the outcome of the FOMC monetary policy announcement.
A dollop of rosy US economic reports probably helped as well. A final revision of second-quarter GDP data confirmed the annualized growth rate at an impressive 4.2 percent, the core PCE inflation gauge topped forecasts to print at 2.1 percent, and durable goods orders unexpectedly posted the largest increase in six months at 4.5 percent.
Crude oil prices were little-changed absent an asset-specific catalyst. A bit of strength early in the session was undone by the Dollar’s advance however, which applied de-facto selling pressure since the commodity is denominated in terms of the benchmark unit on global markets.
PCE INFLATION DATA, EIA OUTPUT REPORT DUE
Looking ahead, the monthly edition of PCE price-growth statistics headlines the economic calendar. The core rate is seen holding on-target at 2 percent for a second consecutive month in August. An upside surprise echoing the cautious improvement in US data outcomes relative to forecasts over the past month may feed further US Dollar gains, punishing commodities.
Monthly EIA energy output data is also on tap. The latest weekly figures put production at a record high of 11.1 million barrels per day. Worries about shrinking global supply after the US-led re-imposition of sanctions on Iran may ease if this is re-emphasized in longer-term figures, sending crude prices lower.
Learn what other traders’ gold buy/sell decisions say about the price trend!
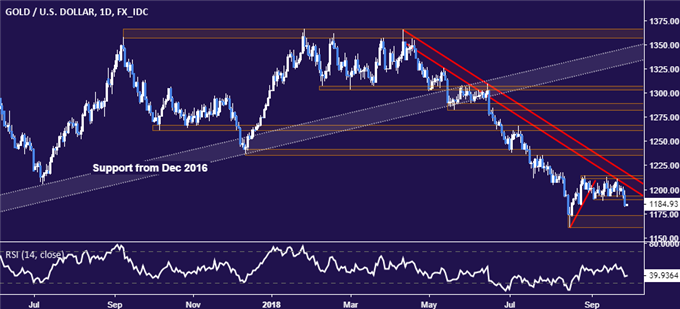
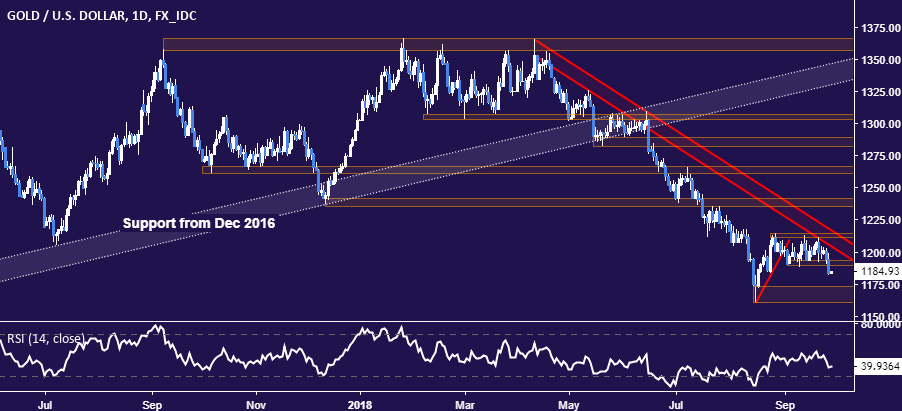
GOLD TECHNICAL ANALYSIS
Gold prices punched through the bottom of the range confining them since late August, marking what looks to be resumption of the downtrend in play since mid-April. Support is now in the 1160.37-73.23 area, with a break below that exposing the December 2016 swing low at 1122.81. Alternatively, a move back above the range floor’s upper boundary at 1193.60 opens the door for another test of trend resistance, now in the 1203.54-16.83 zone.
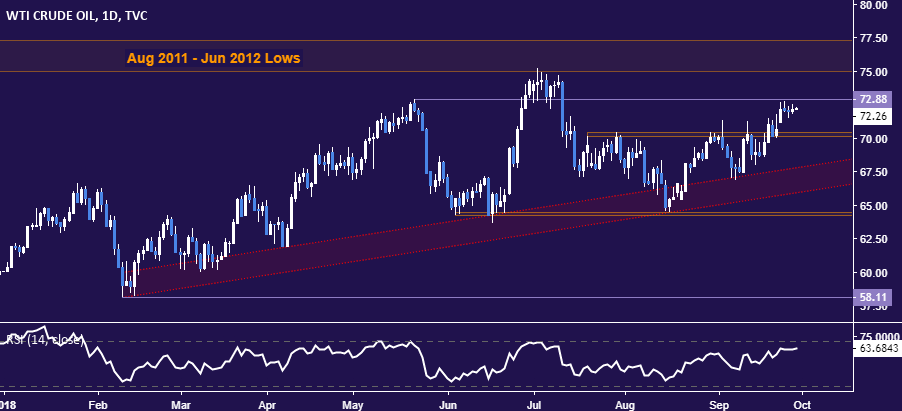
CRUDE OIL TECHNICAL ANALYSIS
Crude oil prices are marking time below chart inflection point resistance at 72.88. A daily close above that opens the door for a test of the 75.00-77.31 area. Alternatively, a turn back below the 70.15-41 zone exposes rising trend support in the 65.92-67.85 region.
COMMODITY TRADING RESOURCES
— Written by Ilya Spivak, Currency Strategist for DailyFX.com
To contact Ilya, use the comments section below or @IlyaSpivak on Twitter