Products You May Like
Talking Points:
– US Dollar weakness has shown quite visibly thus far on the fresh week, with the US Dollar dropping from the 95.00 area of resistance that had come into play around the Friday close. This level of 95.00 was the swing-high for the Month of May, after which this became a key area of support for the US Dollar as the currency gyrated throughout this summer. More recently, as USD-breakdown themes have become more pronounced after the August mid-point, prices have broken-below and are now finding resistance at prior support, keeping the door open for a deeper breakdown in USD.
– Both GBP/USD and EUR/USD are gaining as the Dollar is dropping, but noticeably weaker than USD over the past week has been the Japanese Yen. A Bank of Japan interest rate decision highlights this week’s economic calendar, and the prospect of additional Yen-weakness can keep the bid supported in pairs like EUR/JPY and GBP/JPY. Around the British Pound – we’ll likely continue to see Brexit headlines driving the flow, but we also have a CPI print on the calendar for this Wednesday, and this will likely bring impact to near-term price action.
– DailyFX Forecasts on a variety of currencies such as the US Dollar or the Euro are available from the DailyFX Trading Guides page. If you’re looking to improve your trading approach, check out Traits of Successful Traders. And if you’re looking for an introductory primer to the Forex market, check out our New to FX Guide.
Do you want to see how retail traders are currently trading the US Dollar? Check out our IG Client Sentiment Indicator.
US Dollar Drops From Resistance at Prior Support
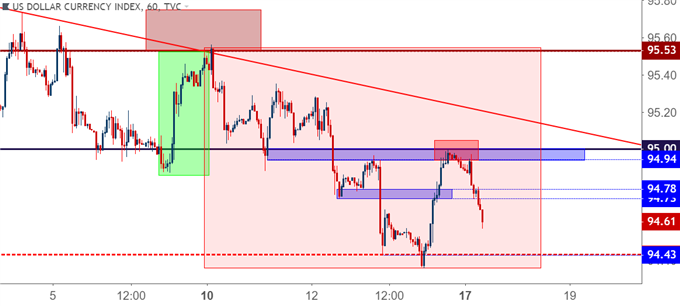
The Dollar is on the move already on the fresh week. Last week closed with a rather strong Friday showing for the US Dollar, as the currency bounced-up from a fresh monthly low to find resistance at the 95.00 level. But – that resistance held as we closed last week and opened this week, with bears taking over shortly after this week’s open.
This 95.00 level has been a big barrier on the USD chart over the past four months, coming in as the swing-high in the month of May and then functioning as varying forms of support for the bulk of the summer. More recently this price had started to come back as support in late-August; but this was unable to stem the declines and at this point, we have a case of resistance showing at prior support. This was the second zone of resistance potential we looked at last week for bearish USD-themes, and the reaction here opens the door for fresh lows and a deeper drop in DXY prices.
US Dollar Hourly Price Chart: Drop From 95.00 Resistance, Prior Support
Chart prepared by James Stanley
A Quieter Calendar Allows for Trends to Avail Themselves
This week’s economic calendar calms a bit from the prior two weeks: We do have rate decisions out of Japan and Switzerland, along with a couple of key data releases with inflation prints from both the UK and Canada. But – noticeably missing are any high-impact items out of the US, and this would provide ample opportunity for prevailing trends to avail themselves as we remove the potential for noise as brought upon by US data releases. Particularly interesting for this week is the Yen around the Bank of Japan rate decision on the schedule for tomorrow night. A return of Yen-weakness was one of the biggest takeaways from last week, and that theme will likely remain in center-stage as we move deeper into this week.
DailyFX Economic Calendar: High-Impact Items for the Week of September 17, 2018

Chart prepared by James Stanley
EUR/USD Attempts to Cauterize Higher-Low Support
Going along with that move of weakness in the Greenback, we have a bullish bounce showing so far on the new week in EUR/USD. The short-term support from which price is bouncing is at an interesting spot around the 1.1604-1.1618 support zone that we’ve been following. This also syncs up with the projection of the prior bearish trend-line, giving a bit of support at prior trend-line resistance.
EUR/USD Four-Hour Price Chart: Higher-Low Support, Bulls Targeting Re-Test of Key Resistance Zone

Chart prepared by James Stanley
The big question surrounding EUR/USD for this week is whether the pair can take out the resistance zone that runs from 1.1709-1.1750. We’ve been following this area for over a month now, and last week gave us yet another resistance reaction at this zone. A topside break of this resistance area opens the door for longer-term bullish continuation strategies in the pair.
EUR/USD Eight-Hour Price Chart: Long-Term Resistance Lurks Ahead
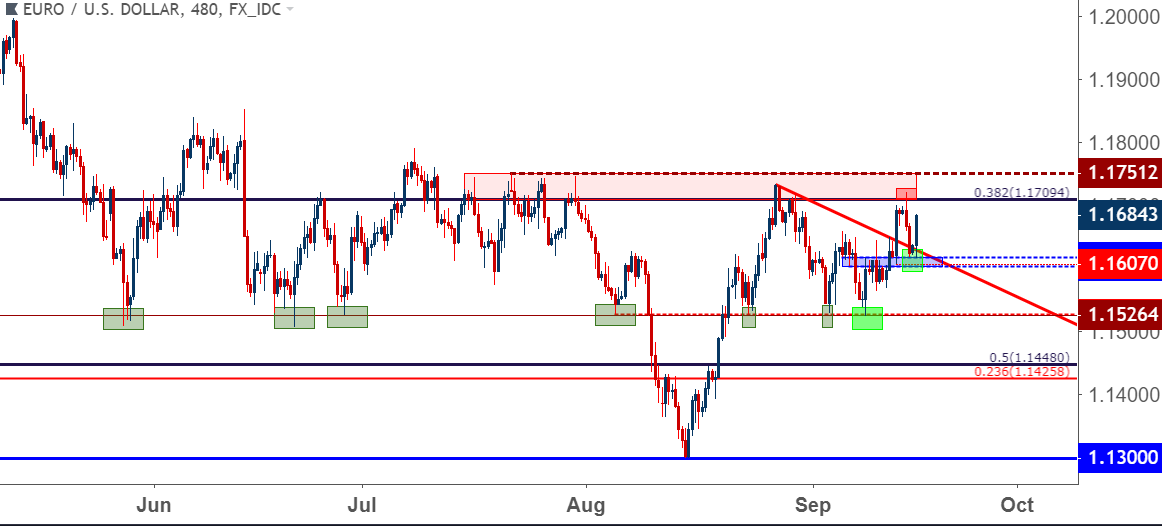
Chart prepared by James Stanley
GBP/USD Testing Through Resistance to Start the Week
Cable is starting the week on a bright note, catching a bid to test above a key area of resistance. We looked at the price of 1.3117 last week, as this is the 38.2% retracement of the Brexit move; and this is the same study from which the 78.6% marker caught the April high while the 23.6% retracement marked the August low.
We were looking for tests through this level to open the door for higher-low support, and bulls appear to be unwilling to wait around for a deeper retracement, at least so far. If we do see buyers continuing to push until a fresh monthly high prints, that price of 1.3117 may have value as higher-low support for shorter-term approaches. Key around the British Pound this week will continue to be caution, as we’re not yet out of the woods on Brexit dynamics and it’s unlikely that we don’t see more headline-induced swings impacting near-term prices. We also get the inflation print out of the UK on Wednesday, and this remains as a key economic driver as this will likely have some element of bearing on the BoE’s stance at their November rate decision.
GBP/USD Eight-Hour Price Chart: Cable Bulls Push Above Resistance, Fresh Monthly Highs
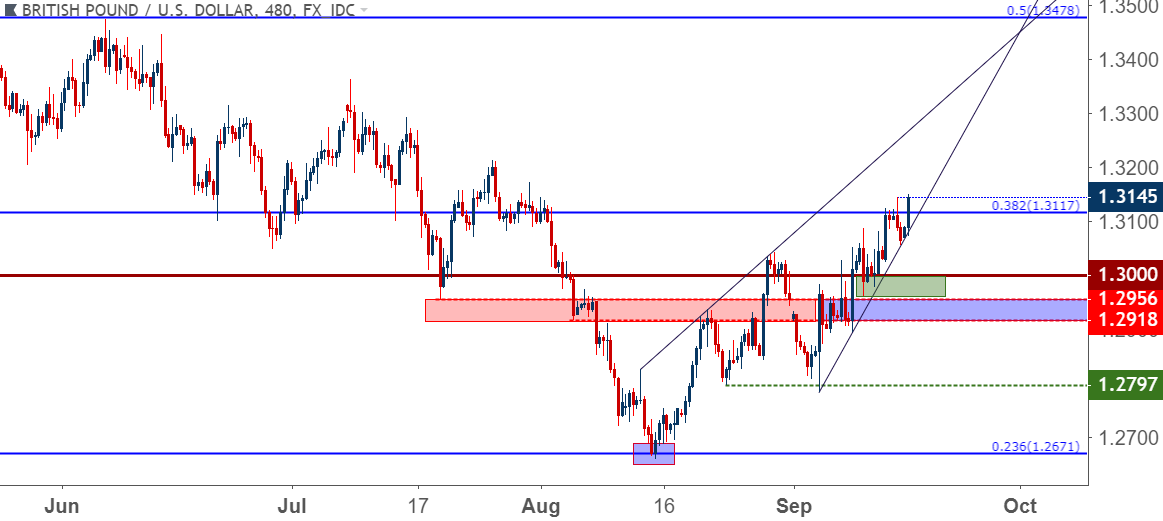
Chart prepared by James Stanley
Yen Weakness Remains Ahead of BoJ
One of the few currencies that’s actually been weaker than the US Dollar of recent has been the Japanese Yen. While USD has been showing varying forms of breakdown against the Euro or the British Pound, USD/JPY has continued to hold near monthly highs as prices remain around 112.00.
The big question here is whether we’re at the forefront of another run of Yen-weakness, as the BoJ is in a position to remain as one of the more loose and dovish Central Banks amongst developed economies. With the ECB announcing their tapering strategy, and with the BoE having already hiked rates twice while the Federal Reserve remains well-entrenched in their rising rate cycle, the BoJ looks nowhere near hiking rates. Inflation remains weak in Japan, and with risk aversion receding behind the headlines, JPY has been able to drop, and this has shown rather visibly in pairs like EUR/JPY and GBP/JPY.
In USD/JPY, near-term price action remains rather messy. We are trading at fresh monthly highs, but bulls haven’t yet been able to make much ground above the early-August swing-high. If we consider how weak the US Dollar has been of recent, this is noteworthy, highlighting how the Yen has been even weaker, making it an ideal currency to match up with a currency that’s been strong of recent to create a respectable deviation within the pair.
USD/JPY Eight-Hour Price Chart: Holding at Monthly Highs as Yen Weakness outpaces USD Sell-Off
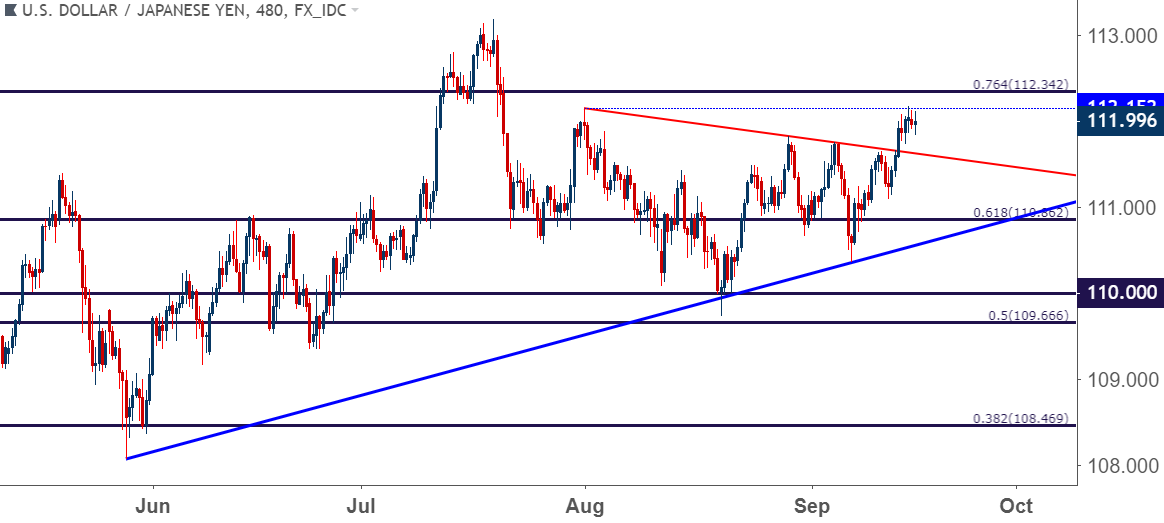
Chart prepared by James Stanley
EUR/JPY
For bullish Euro strategies, this may be a bit more attractive than EUR/USD. While EUR/USD has a rather rigid area of resistance just ahead, EUR/JPY has already started to test the early-August swing-high, and we’ve seen a respectable hold of higher-low support in the region from 130-130.35, the same zone we looked at last week in our tech article on the pair entitled, EUR/JPY Prices Hold at Fibonacci Resistance Ahead of ECB.
EUR/JPY Four-Hour Price Chart: Bounce From Higher-Low Support Zone
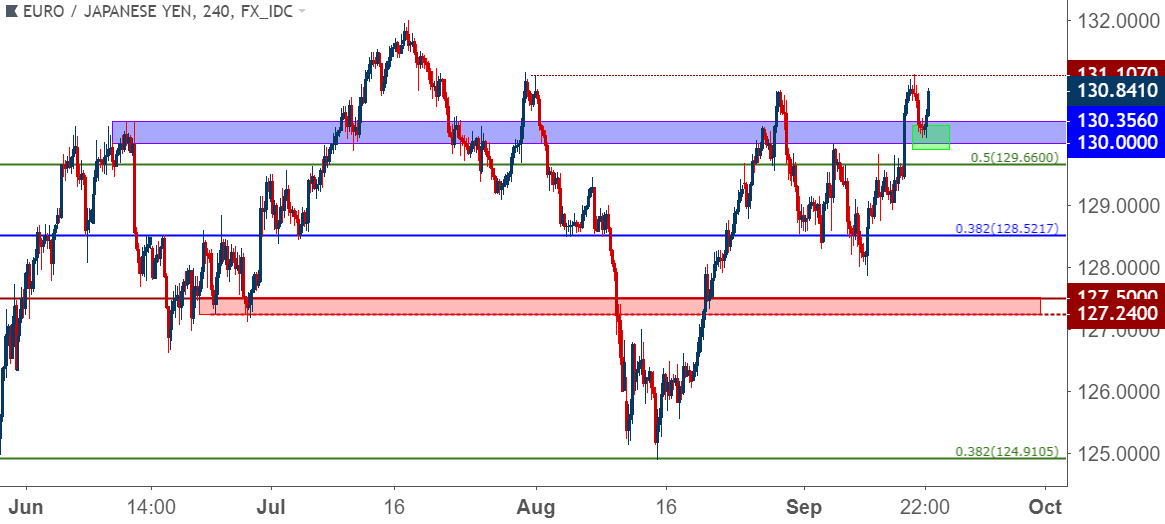
Chart prepared by James Stanley
GBP/JPY
This one could remain volatile this week, particularly around Wednesday as the Tuesday night/Wednesday morning BoJ rate decision runs into the UK inflation report on the calendar for Wednesday morning.
Price action in the pair really opened up last week as buyers pushed up to a key area on the chart. The price of 147.04 has been in-play for a while now, and this is the 61.8% retracement of the ‘Abenomics’ move in GBP/JPY, taking the 2011 low up to the 2015 high. This price helped to form a double bottom in October and November of last year, and then offered a shorter-term version of the same observation in May of this year. Most recently – this price helped to form the August swing-high, and then the same area helped to cap last week’s gains as bulls grasped control of the pair.
GBP/JPY Daily Price Chart: Testing Through Key Fibonacci Level at 147.04
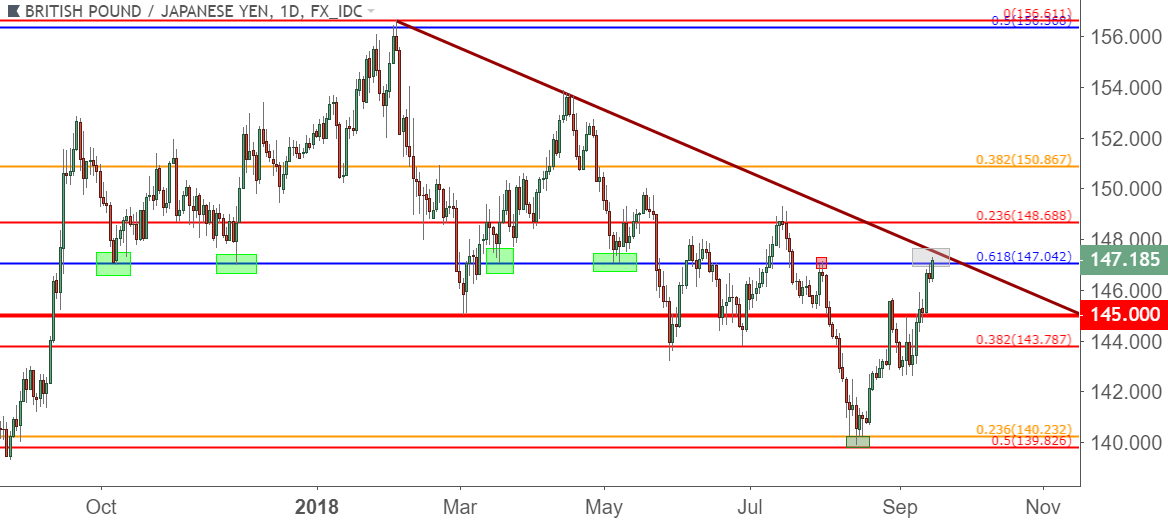
Chart prepared by James Stanley
We’re now testing through this price, and this can keep the door open for bullish continuation strategies. Chasing here could be a bit dangerous, however, so traders would likely want to wait for the setup to clear up a bit. If prices are able to continue running-higher through today, the door could be open for support at prior resistance around 147.04. But – if the bullish response above this level fails to show much run above resistance, then traders would likely want to keep those views for higher-low support confined to the prior support zones around 146.23 and a bit deeper, running from 145.31 up to 145.69.
GBP/JPY Four-Hour Price Chart: Bullish Continuation Potential
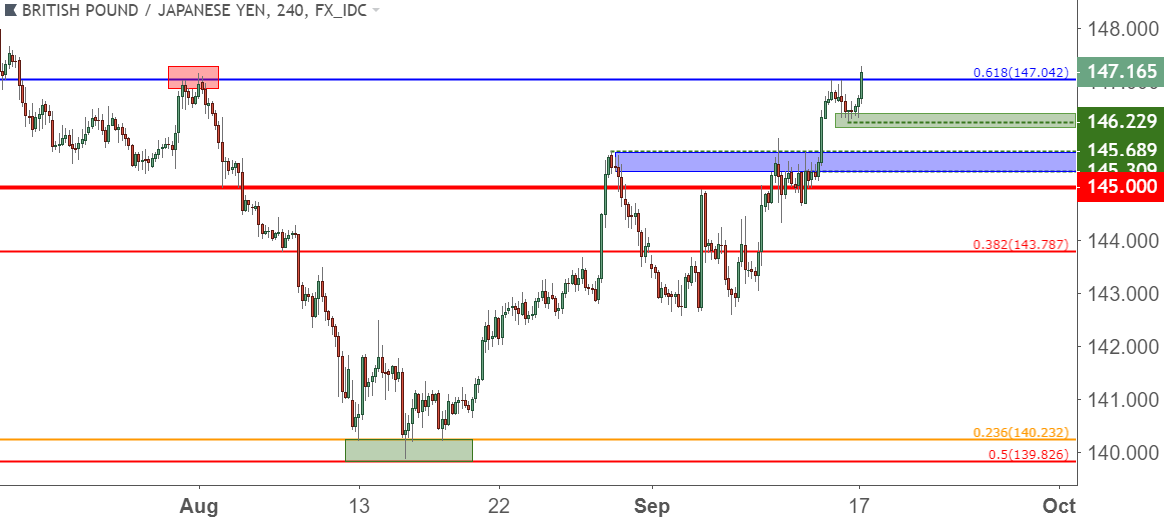
Chart prepared by James Stanley
To read more:
Are you looking for longer-term analysis on the U.S. Dollar? Our DailyFX Forecasts for Q3 have a section for each major currency, and we also offer a plethora of resources on USD-pairs such as EUR/USD, GBP/USD, USD/JPY, AUD/USD. Traders can also stay up with near-term positioning via our IG Client Sentiment Indicator.
Forex Trading Resources
DailyFX offers a plethora of tools, indicators and resources to help traders. For those looking for trading ideas, our IG Client Sentiment shows the positioning of retail traders with actual live trades and positions. Our trading guides bring our DailyFX Quarterly Forecasts and our Top Trading Opportunities; and our real-time news feed has intra-day interactions from the DailyFX team. And if you’re looking for real-time analysis, our DailyFX Webinars offer numerous sessions each week in which you can see how and why we’re looking at what we’re looking at.
If you’re looking for educational information, our New to FX guide is there to help new(er) traders while our Traits of Successful Traders research is built to help sharpen the skill set by focusing on risk and trade management.
— Written by James Stanley, Strategist for DailyFX.com
Contact and follow James on Twitter: @JStanleyFX