Products You May Like
This is via SG’s daily technical analysis – I’ve snipped out the bit on the Australian dollar
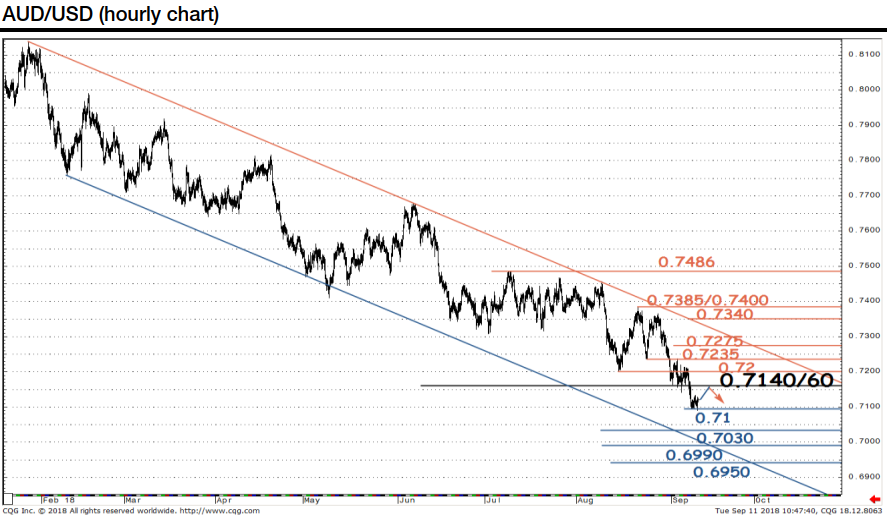
Société Générale have highlighted support and resistance levels, included under the chart
AUD/USD is piercing below the graphical support of 0.7140/60 which represents the lows of May / December 2016. The pair could head towards next objective at 0.6990, the down sloping channel lower limit and even a projection at 0.6950. Lows formed in January 2016 at 0.6825 will be an important support medium term.
(chart from a few hours ago)
Support and resistance levels (or other way round I guess)
- 0.7275
- 0.7235
- 0.72
- 0.71
- 0.7030
- 0.6990
This article was originally published by Forexlive.com. Read the original article here.