
Products You May Like
US/Canada talks to come….
We cannot predict the future unfortunately in what is some key “either way” possible outcomes (i.e. does US and Canada agree to a deal, who wins the election, can the deal be passed, etc.).
Technically, the price action and tools will help traders with bias.
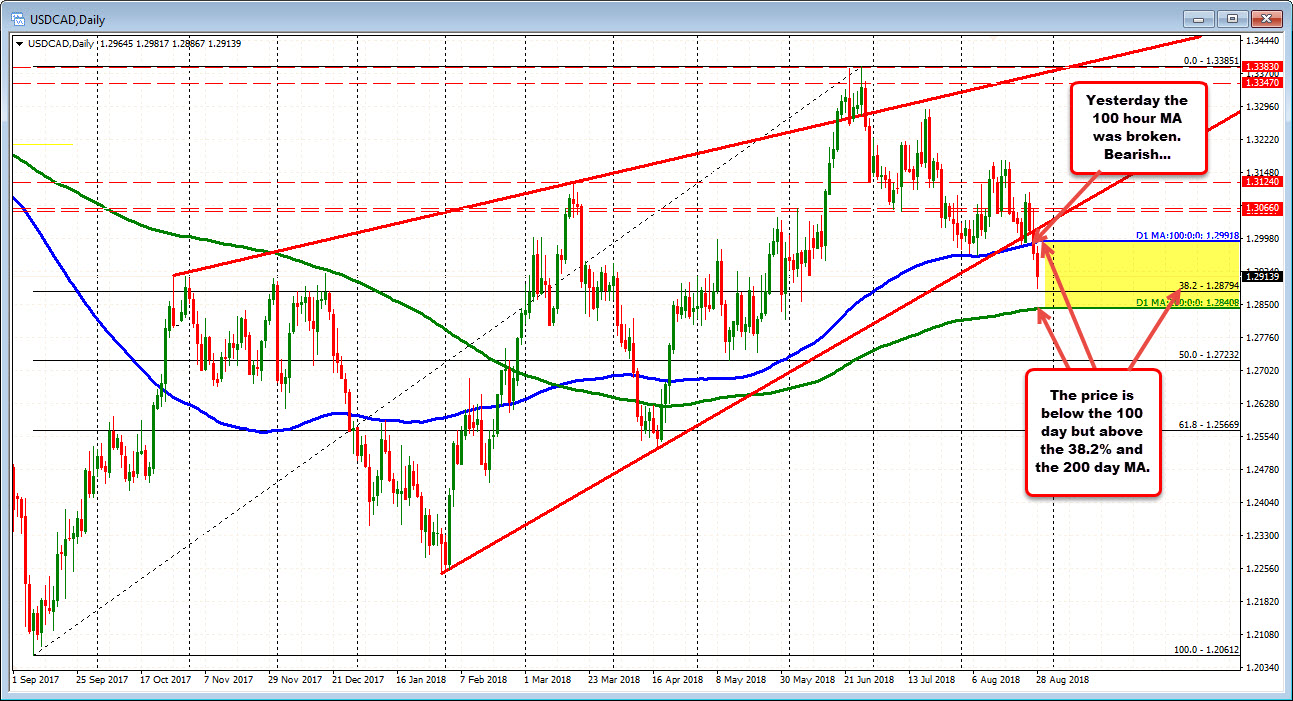
Looking at the daily chart above, the price fell below the 100 day MA at 1.29918 yesterday. Earlier in the month, the price tested the MA and bounced on 3 separate occasions. Buyers showed up. That was not the case yesterday and the bears took control.
The fall took the price toward the 38.2% at 1.28794 (low reached 1.28867). That 38.2% will need to be broken to increase the bearish bias. Below that level sits the 200 day MA at 1.28408. That is another key target for the bears.
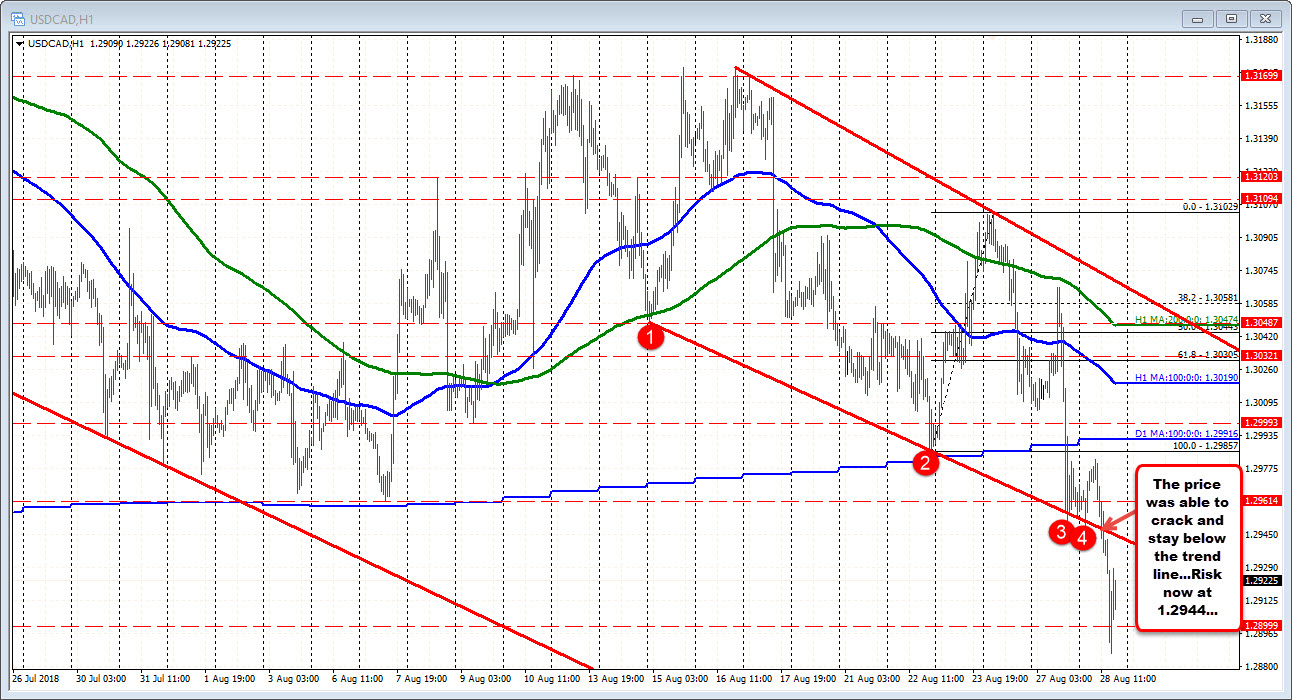
Drilling to the hourly chart below, the price tested a lower trend line yesterday and in the early hours today and held. However, that trend line was eventually broken today at around the 1.2948 level and that helped to kick the price lower. The low reached 1.28867, before the USD bounce higher. The broken trend line at 1.2944 now is a risk level for shorts (CAD bulls). Stay below keep the sellers more in control. .
The uncertainty from US/Canada talks probably warrants some caution from traders on getting too bullish or too bearish.
As a result, the price moving between the 100 and 200 day MA at 1.29918 (100 day MA above) and 1.28408 (200 day MA below) is a neutral area for the price to wander as the cards are played in Washington.
IN between those daily MA extremes, sits the 38.2% at 1.28794 below, and the broken trend line at 1.2944 above (and falling). Those levels should give traders a bias clue. Today the dip buyers leaned against the 38.2% retracement. Eye the broken trend line on a continuation move higher.