
Products You May Like
Technical techniques for following the trend
If you have been
trading for any amount of time, you have likely read about trend following –
which can be used as a forex
trading strategy.
Is it truly the allegorical Holy Grail of trading? Let’s dive deeper into Trend
Following and see if it lives up to the reputation that it has amongst both
novice and experienced Forex traders.
If you are
unfamiliar with Trend Following, it is a system to help predict the direction.
This information is said to assist traders open and close trades more
strategically.
Indicators
Arguably the most
popular way to interpret charts is using Indicators. In very simple terms
indicators are a variety of mathematical price calculations that can
potentially help highlight trends – for example simple moving average (SMA),
plots the past prices’ arithmetic mean on a line as seen below in the EUR/USD Forex chart.
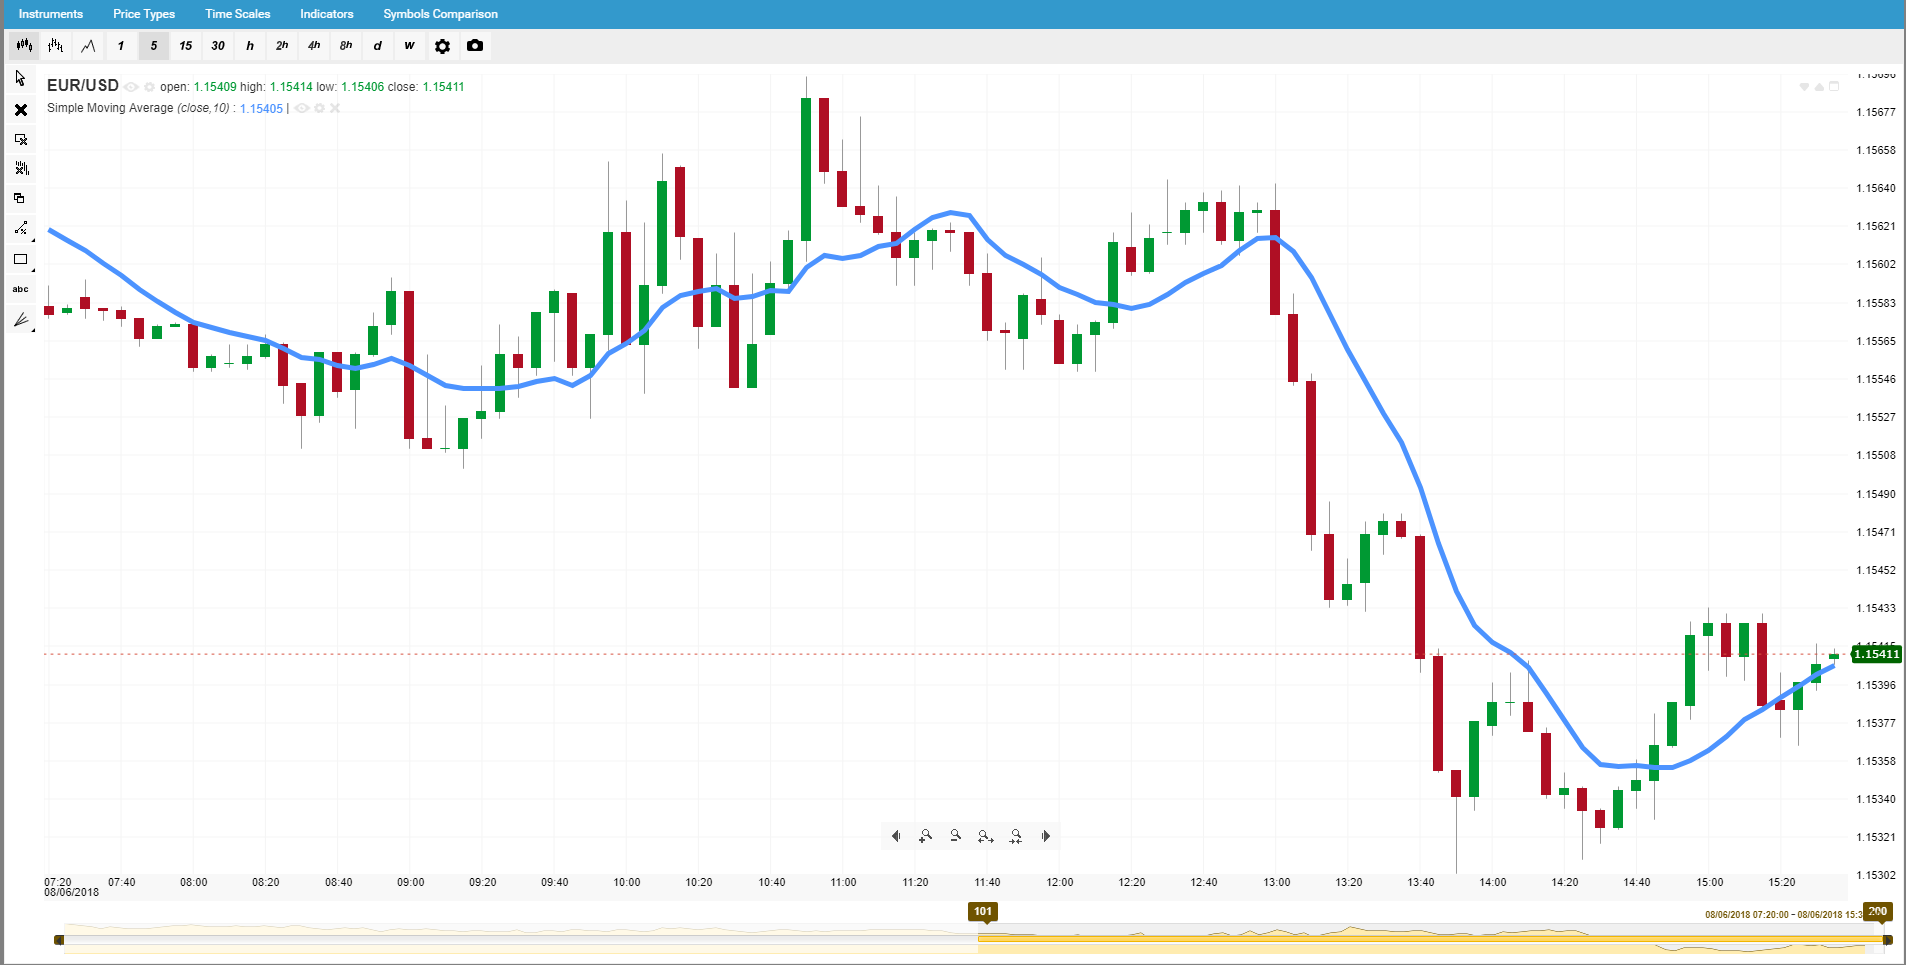
As you can see
averaging out the prices give a much clearer image of the general movement of
the rate. Small temporary reversals average out and become plotted on a line
that is in a downtrend or uptrend. The calculation can be made across various
timeframes 200, 100 and 50 days.
Extending the
timeframe smooths SMA line whereas
contracting sharpens SMA line.
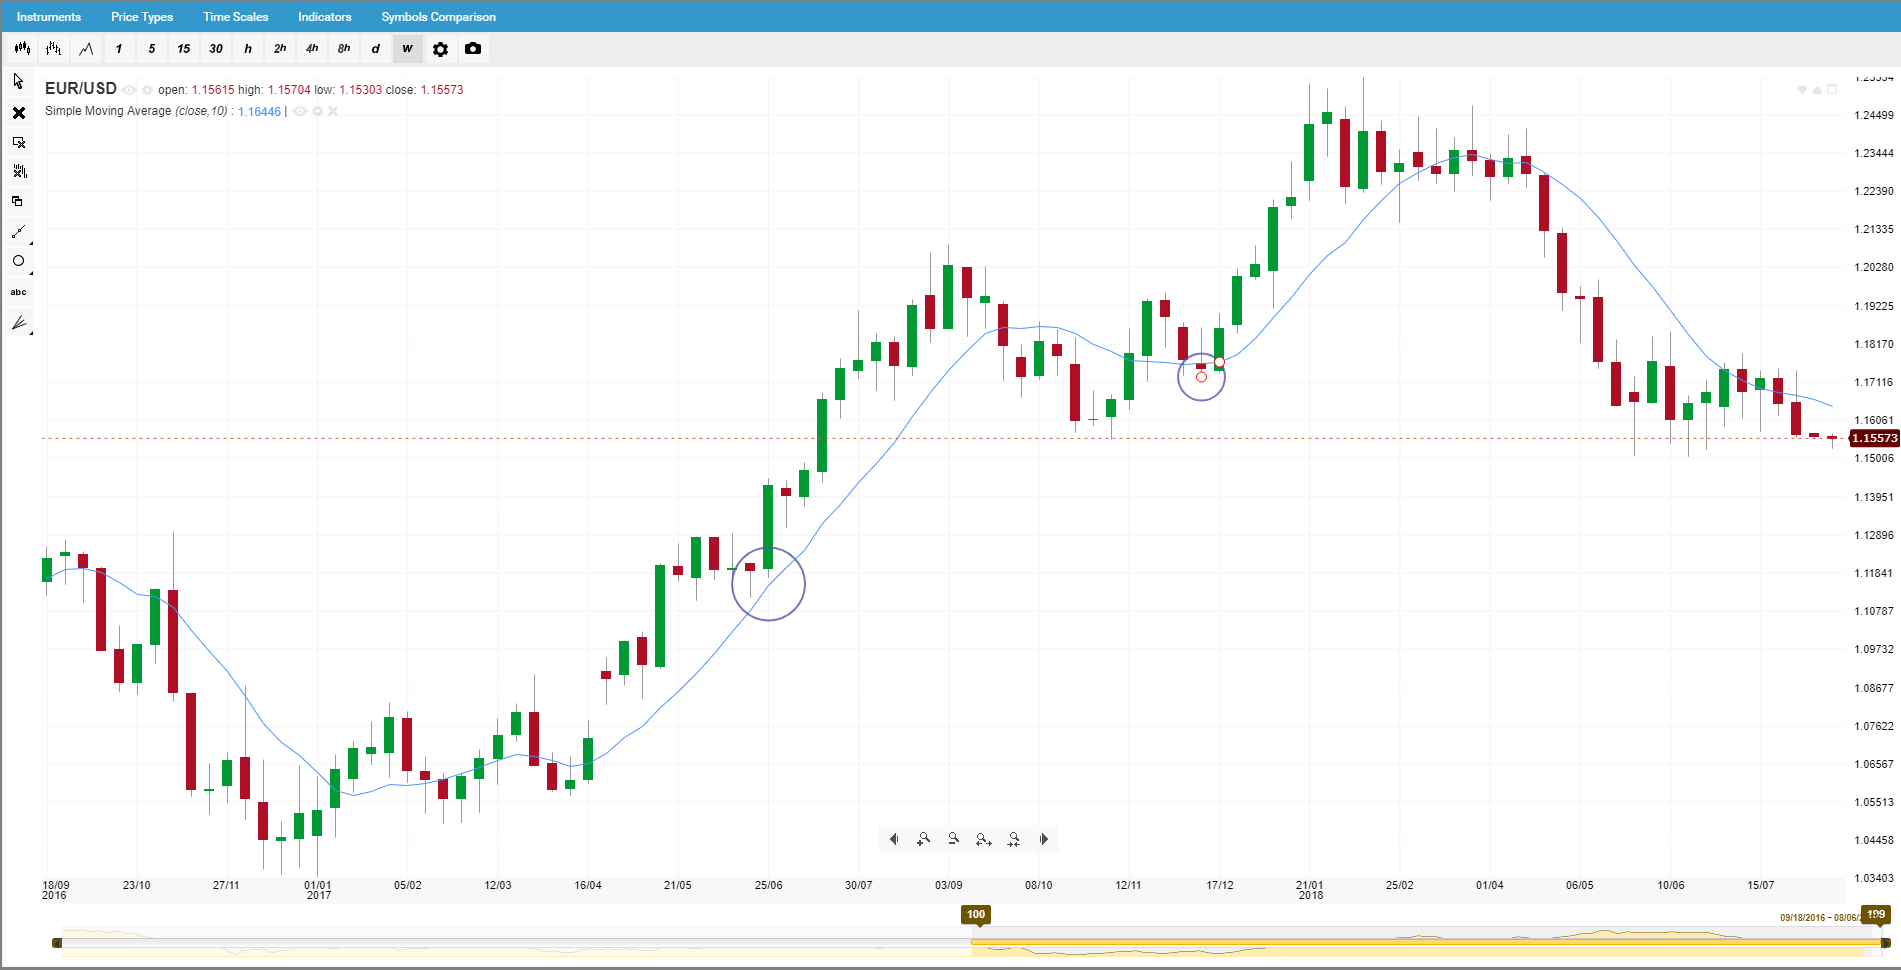
Another
interesting effect is when the SMA acts as support or resistance – where the
price goes under or approaches the level delineated by the SMA and then returns
above. Here is an example indicated by the circles on the chart below.
Of course, there
are more variations of the Moving Average that involve more sophisticated
calculations that emphasize different moments of the market cycle.
RSI
(Relative Strength Index)
RSI is known as an
oscillator that is indexed between 0 and 100. When the indicator is above 70,
the asset is considered in the overbought region where as if it is under 30 it
is the oversold region. When the instrument is overbought it is consider it
will undergo correction and if it oversold that it will recover.
RSI is probably
not the best indicator to use alone – unlike SMA – because frequently the RSI
will remain above 70 or below 30 for extended periods of time. So, using it in
conjunction with other indicators can serve as another piece of the technical
analysis puzzle.
Bollinger
Bands
One of the few registered
trademark indicators, Bollinger Bands have been garnering interest recently.
Bollinger Bands, literally bands (as the name indicates) an asset’s 21-day
simple moving average between standard deviations above and below the SMA. It
helps the analysts see volatility more clearly – when volatility is low, the
bands narrow when volatility increases the bands widen.
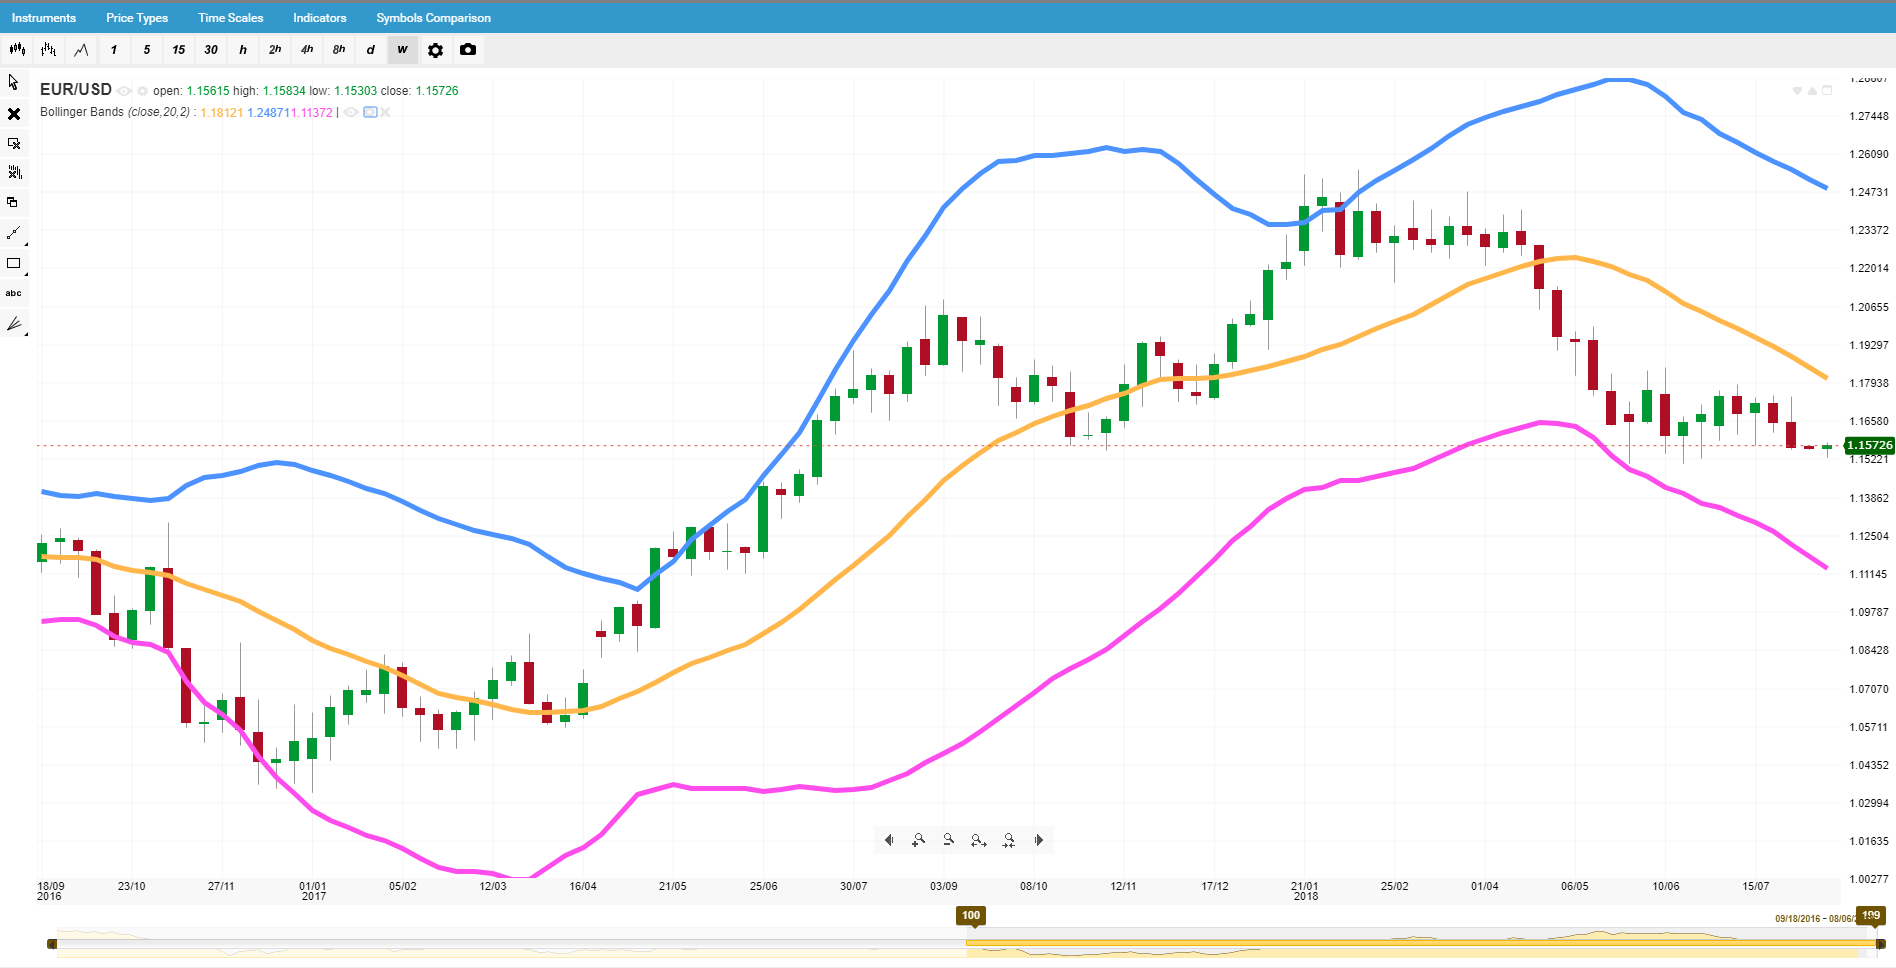
Another way
Bollinger Bands contextualize trends is as the price moves towards the upper
band it is considered in the overbought region, as the price approaches the
lower band the opposite is true, i.e. the asset is undersold. Unlike other
indicators but similar to RSI, Bollinger Bands do not give specific signals,
but instead an overall look of the markets and volatility.
Also, like RSI,
Bollinger Bands are not design or conceptualized to used alone. According to
the person that created them John, Bollinger, they should be used with other
non-related indicators.
If you have been
trading for long enough then you are well aware that multiple variables
contribute to a successful trading strategy.
Not only should
you use a combination of technical and fundamental analysis but also partner
with a broker that offers the best trading conditions and protections,
for your style of trading.
This
article was submitted by easyMarkets