Products You May Like
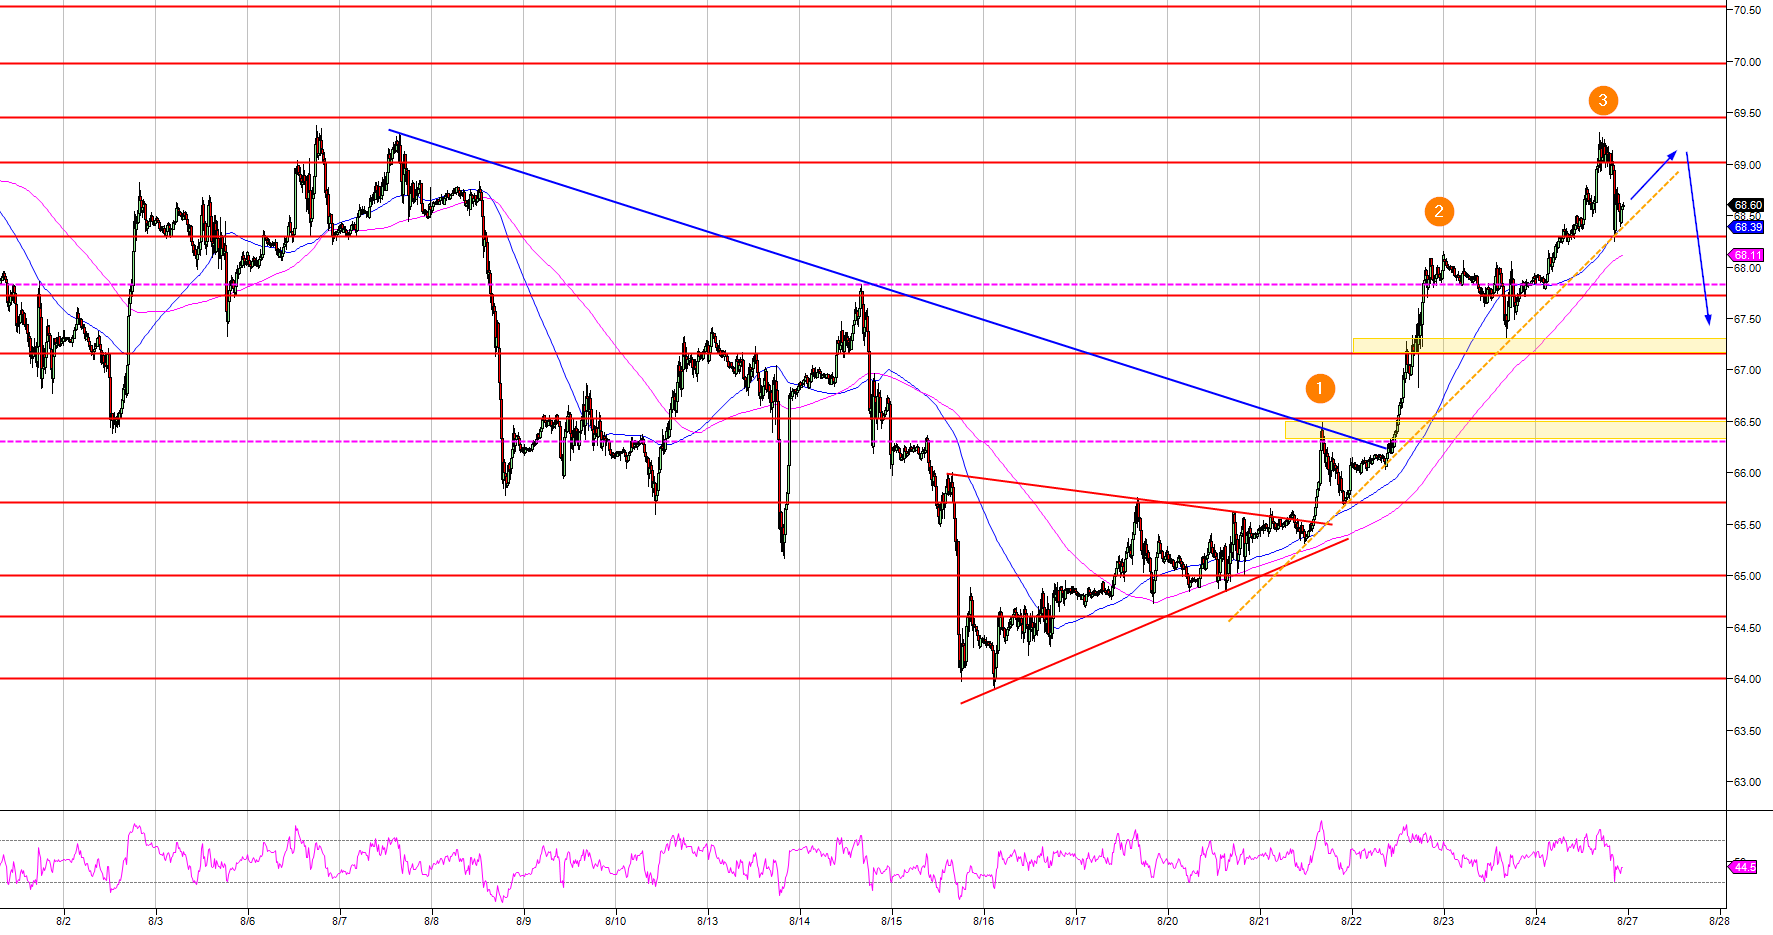
- Crude oil bulls showed on Friday that the main bull trend is still alive despite the deep pullback since early July.
- Oil has made three pushes up (after the red triangle) and the market might be ripe for a pullback down as WTI is finding some resistance at the 69.00 figure and the 50 and 100-period simple moving averages on the daily chart.
- If oil breaks below 68.30, targets to the downside are located at 67.16 and 66.53 swing points. A bull failure on a retest of 69.00 figure can be a short opportunity as well for a near-term revesral down.
Spot rate: 69.60
Relative change: 1.12%
High: 69.28
Low: 67.76
Main Trend: Bullish
Short-term trend: Bearish below 68.30 or a failure above 69.00
Resistance 1: 69.00 figure
Resistance 2: 69.44 June 25 high
Resistance 3: 70.00 figure
Support 1: 68.30 supply/demand level
Support 2: 67.84 August 14 swing high
Support 3: 67.16-67.72 June 14 high-June 26 low
Support 4: 66.30-66.53 area, July 18 swing low and June 20 high
Support 5: 65.71, June 22 low
Support 6: 64.60 May 28 low
Support 7: 64.00 figure
Support 8: 63.63 June 11 low
Support 9: 62.40 June 18 low

