
Products You May Like
- The GBP/USD main trend is taking a breather as bulls are pushing the currency pair to a two-day high.
- The bulls are having a breakout above 1.2723 key level. The 50-period simple moving average crossed above the 200 SMA suggesting a slightly bullish bias. Targets to the upside are located near 1.2789 and 1.2838, August 10 high.
- A bear breakout below 1.2723 would invalidate the short-term bullish bias.
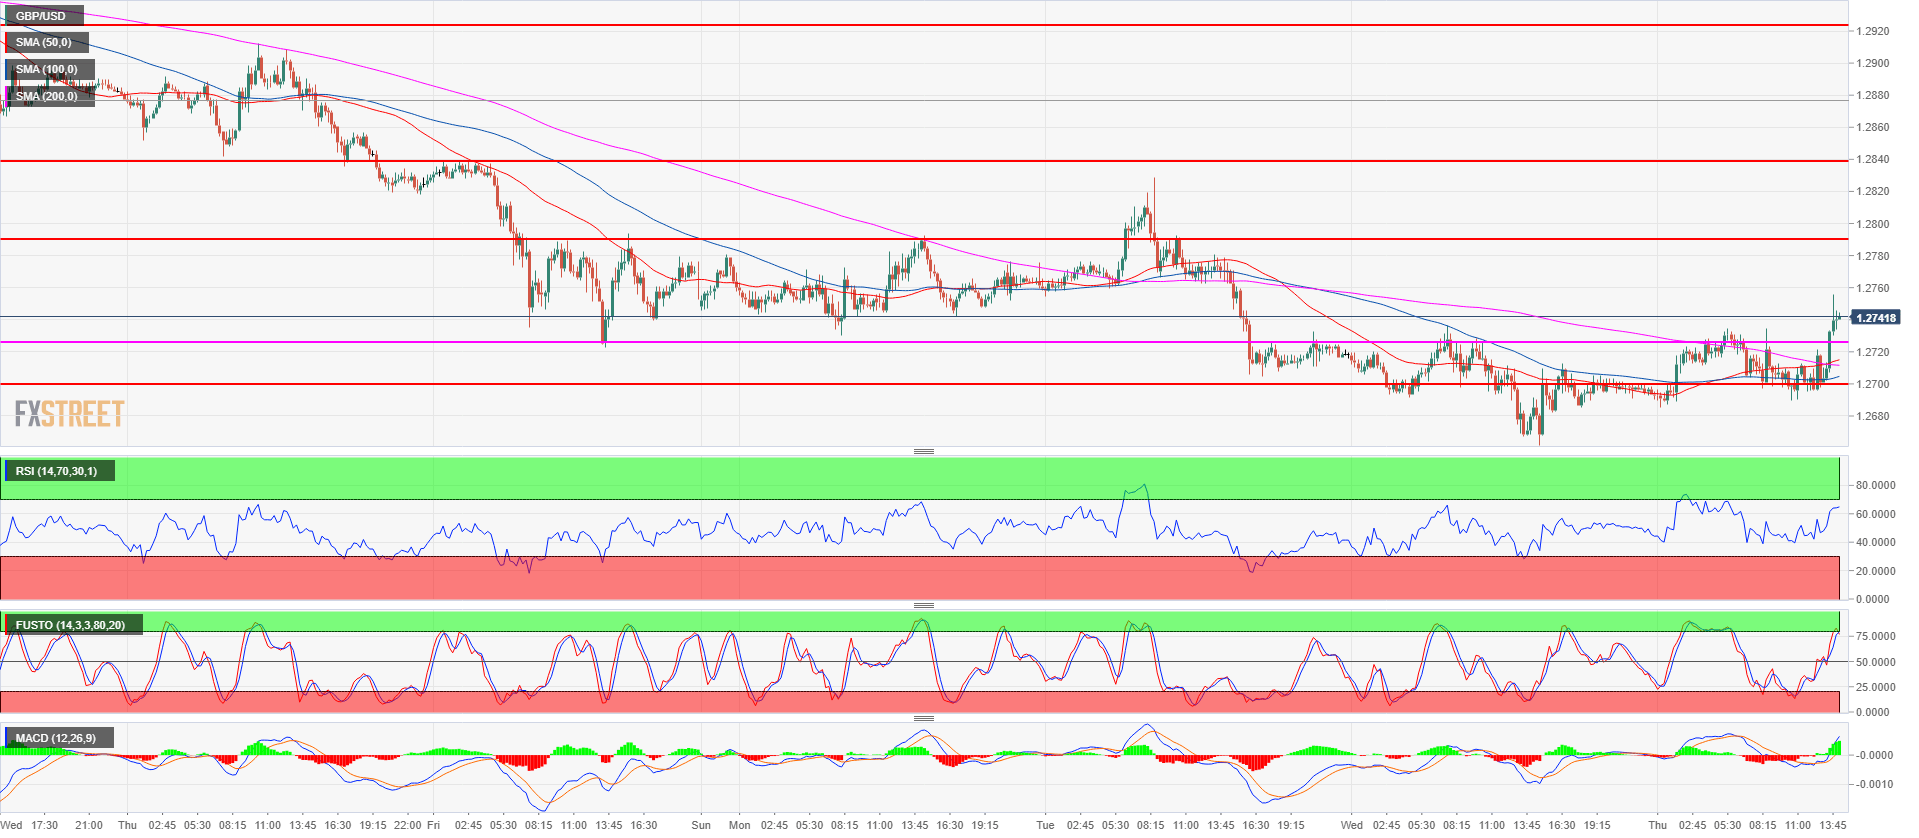
Spot rate: 1.2736
Relative change: 0.30%
High: 1.2755
Low: 1.2685
Trend: Bearish
Resistance 1: 1.2789 intraday swing high
Resistance 2: 1.2838, August 10 high
Resistance 3: 1.2900-1.2923 area, figure and August 7 low
Support 1: 1.2723, August 10 low
Support 2: 1.2700 figure
Support 3: 1.2589 June 21, 2017 low
Support 4: 1.2500 figure
Support 5: 1.2365 April 7, 2017 high
This article was originally published by Fxstreet.com. Read the original article here.