
Products You May Like
• Lingering fears about Turkey’s financial crisis exerted some fresh selling pressure around equities and was seen benefitting the Japanese Yen’s safe-haven appeal.
• The pair retreated sharply from a one-week high level of 111.43 and broke below a short-term ascending trend-channel formation on the 1-hourly chart.
• A follow-through weakness below 200-hour SMA was a key trigger for bearish traders, though the selling pressure now seems to have abated near 100-hour SMA.
• Despite the bearish technical set-up, it would be prudent to wait for a decisive break below 100-hour SMA before positioning for any further downside.
USD/JPY 1-hourly chart
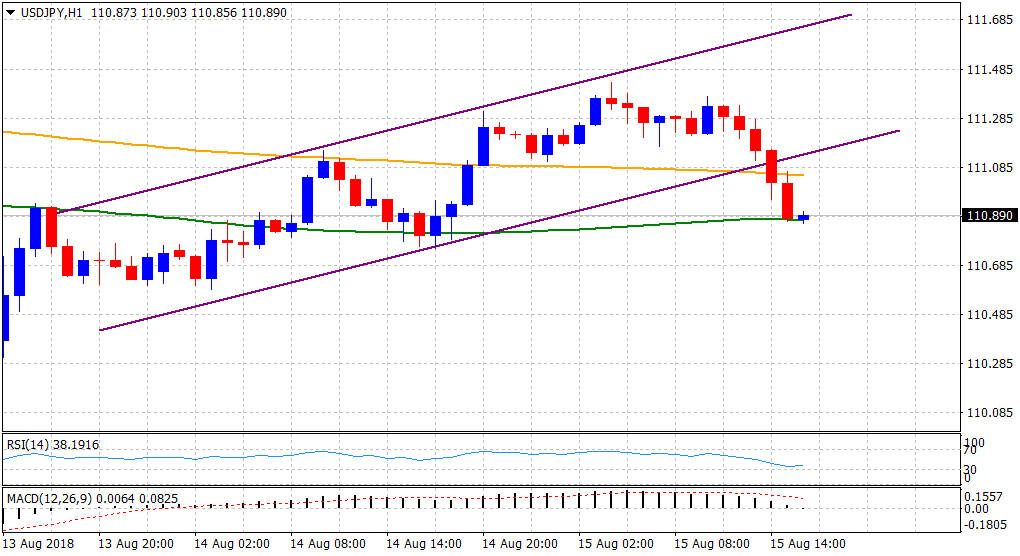
Spot Rate: 110.89
Daily High: 111.43
Trend: Turning bearish again
Resistance
R1: 111.05 (200-period SMA H1)
R2: 111.43 (current day swing high)
R3: 111.77 (R2 daily pivot-point)
Support
S1: 110.59 (overnight swing low)
S2: 110.28 (S2 daily pivot-point)
S3: 110.00 (psychological round figure mark)