Products You May Like
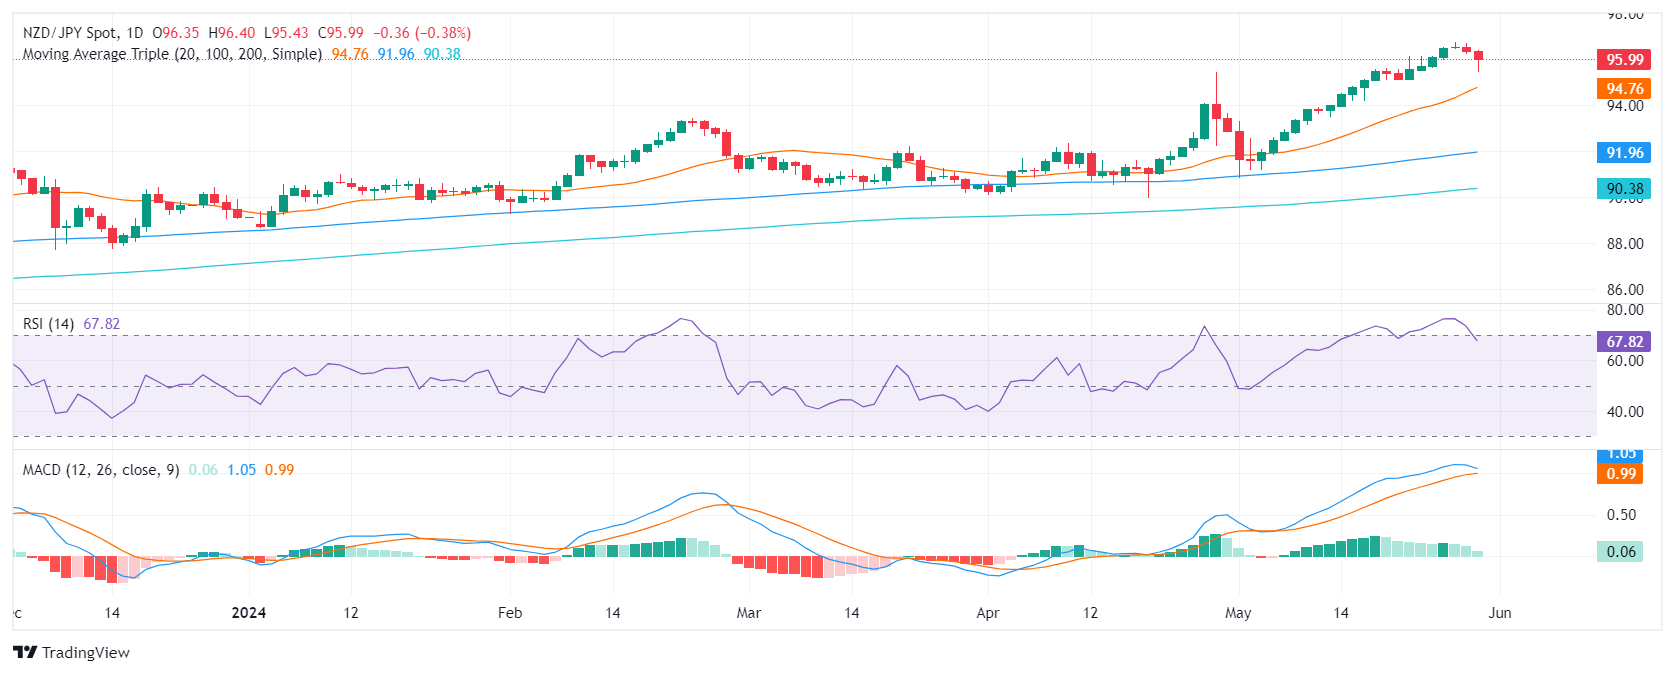
- The daily chart escapes overbought signals as the overall trend begins to consolidate.
- After reaching multi-year highs above 96.70, NZD/JPY enters a phase of consolidation with support found at 95.50.
- The 95.00 offers strong support to prevent further losses.
On Thursday’s trading session, the NZD/JPY pair underwent further corrections, with sellers gaining momentum. Nonetheless, the pair managed to clear some losses and found strong support at 95.50. Traders are also eying the 95.00 threshold to prevent further losses. While signs of a possible reversal in momentum have waned, the overall outlook remains a phase of consolidation.
According to the daily chart indicators, the Relative Strength Index (RSI) now stands below 70, reflecting a change from previous overbought conditions. This coincides with a potential pause or slow in price gains. Simultaneously, the Moving Average Convergence Divergence (MACD) indicates a decrease in positive momentum with shrinking green bars.
NZD/JPY daily chart

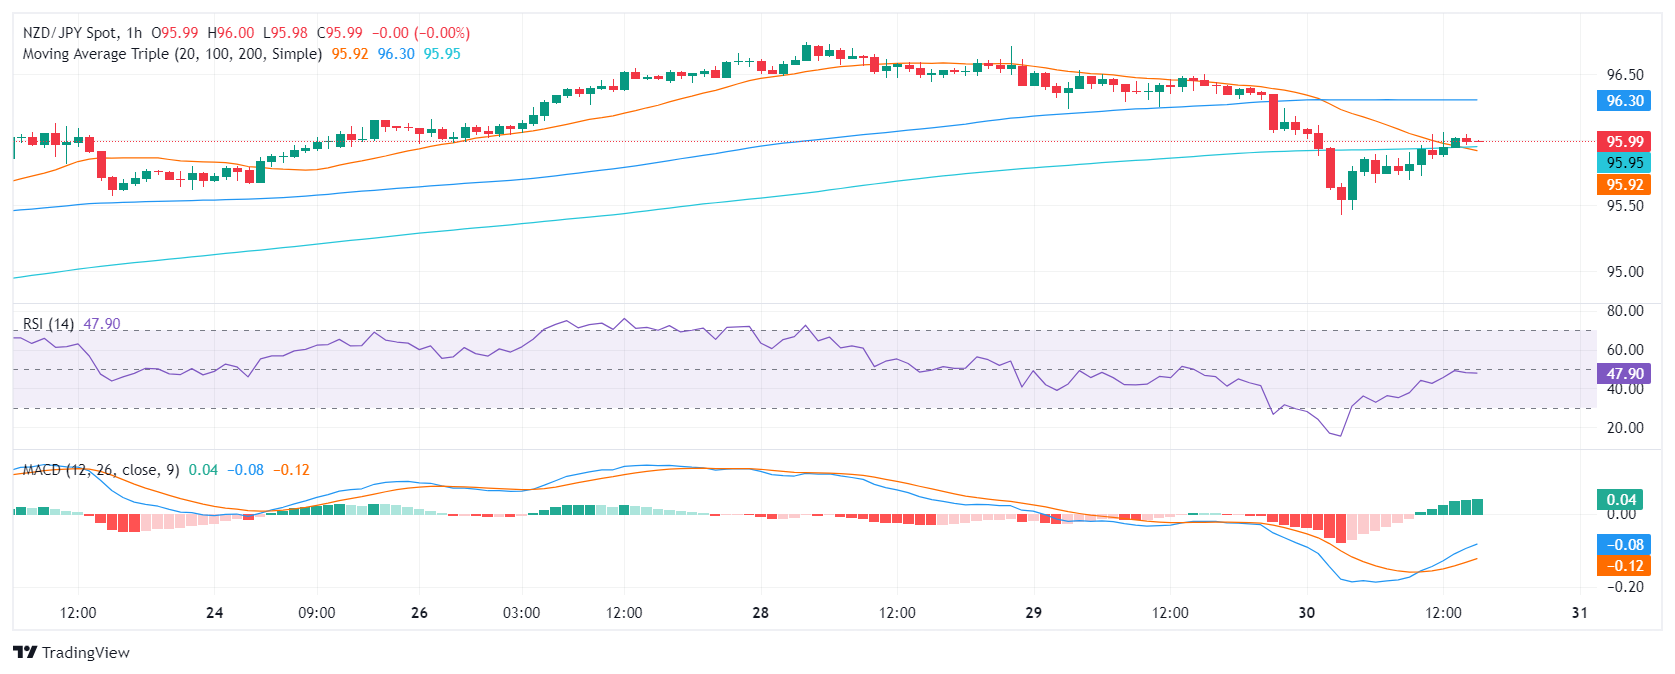
Glancing at the hourly chart, the RSI and MACD histograms have both flattened in negative territory. This suggests that sellers may be losing traction on an hourly basis, indicating consolidation.
NZD/JPY hourly chart

As the consolidation phase continues, any downward movements that keep the pair above its Simple Moving Averages (SMAs) could be considered corrective, providing the pair stays above the key support level of 95.00.
