
Products You May Like
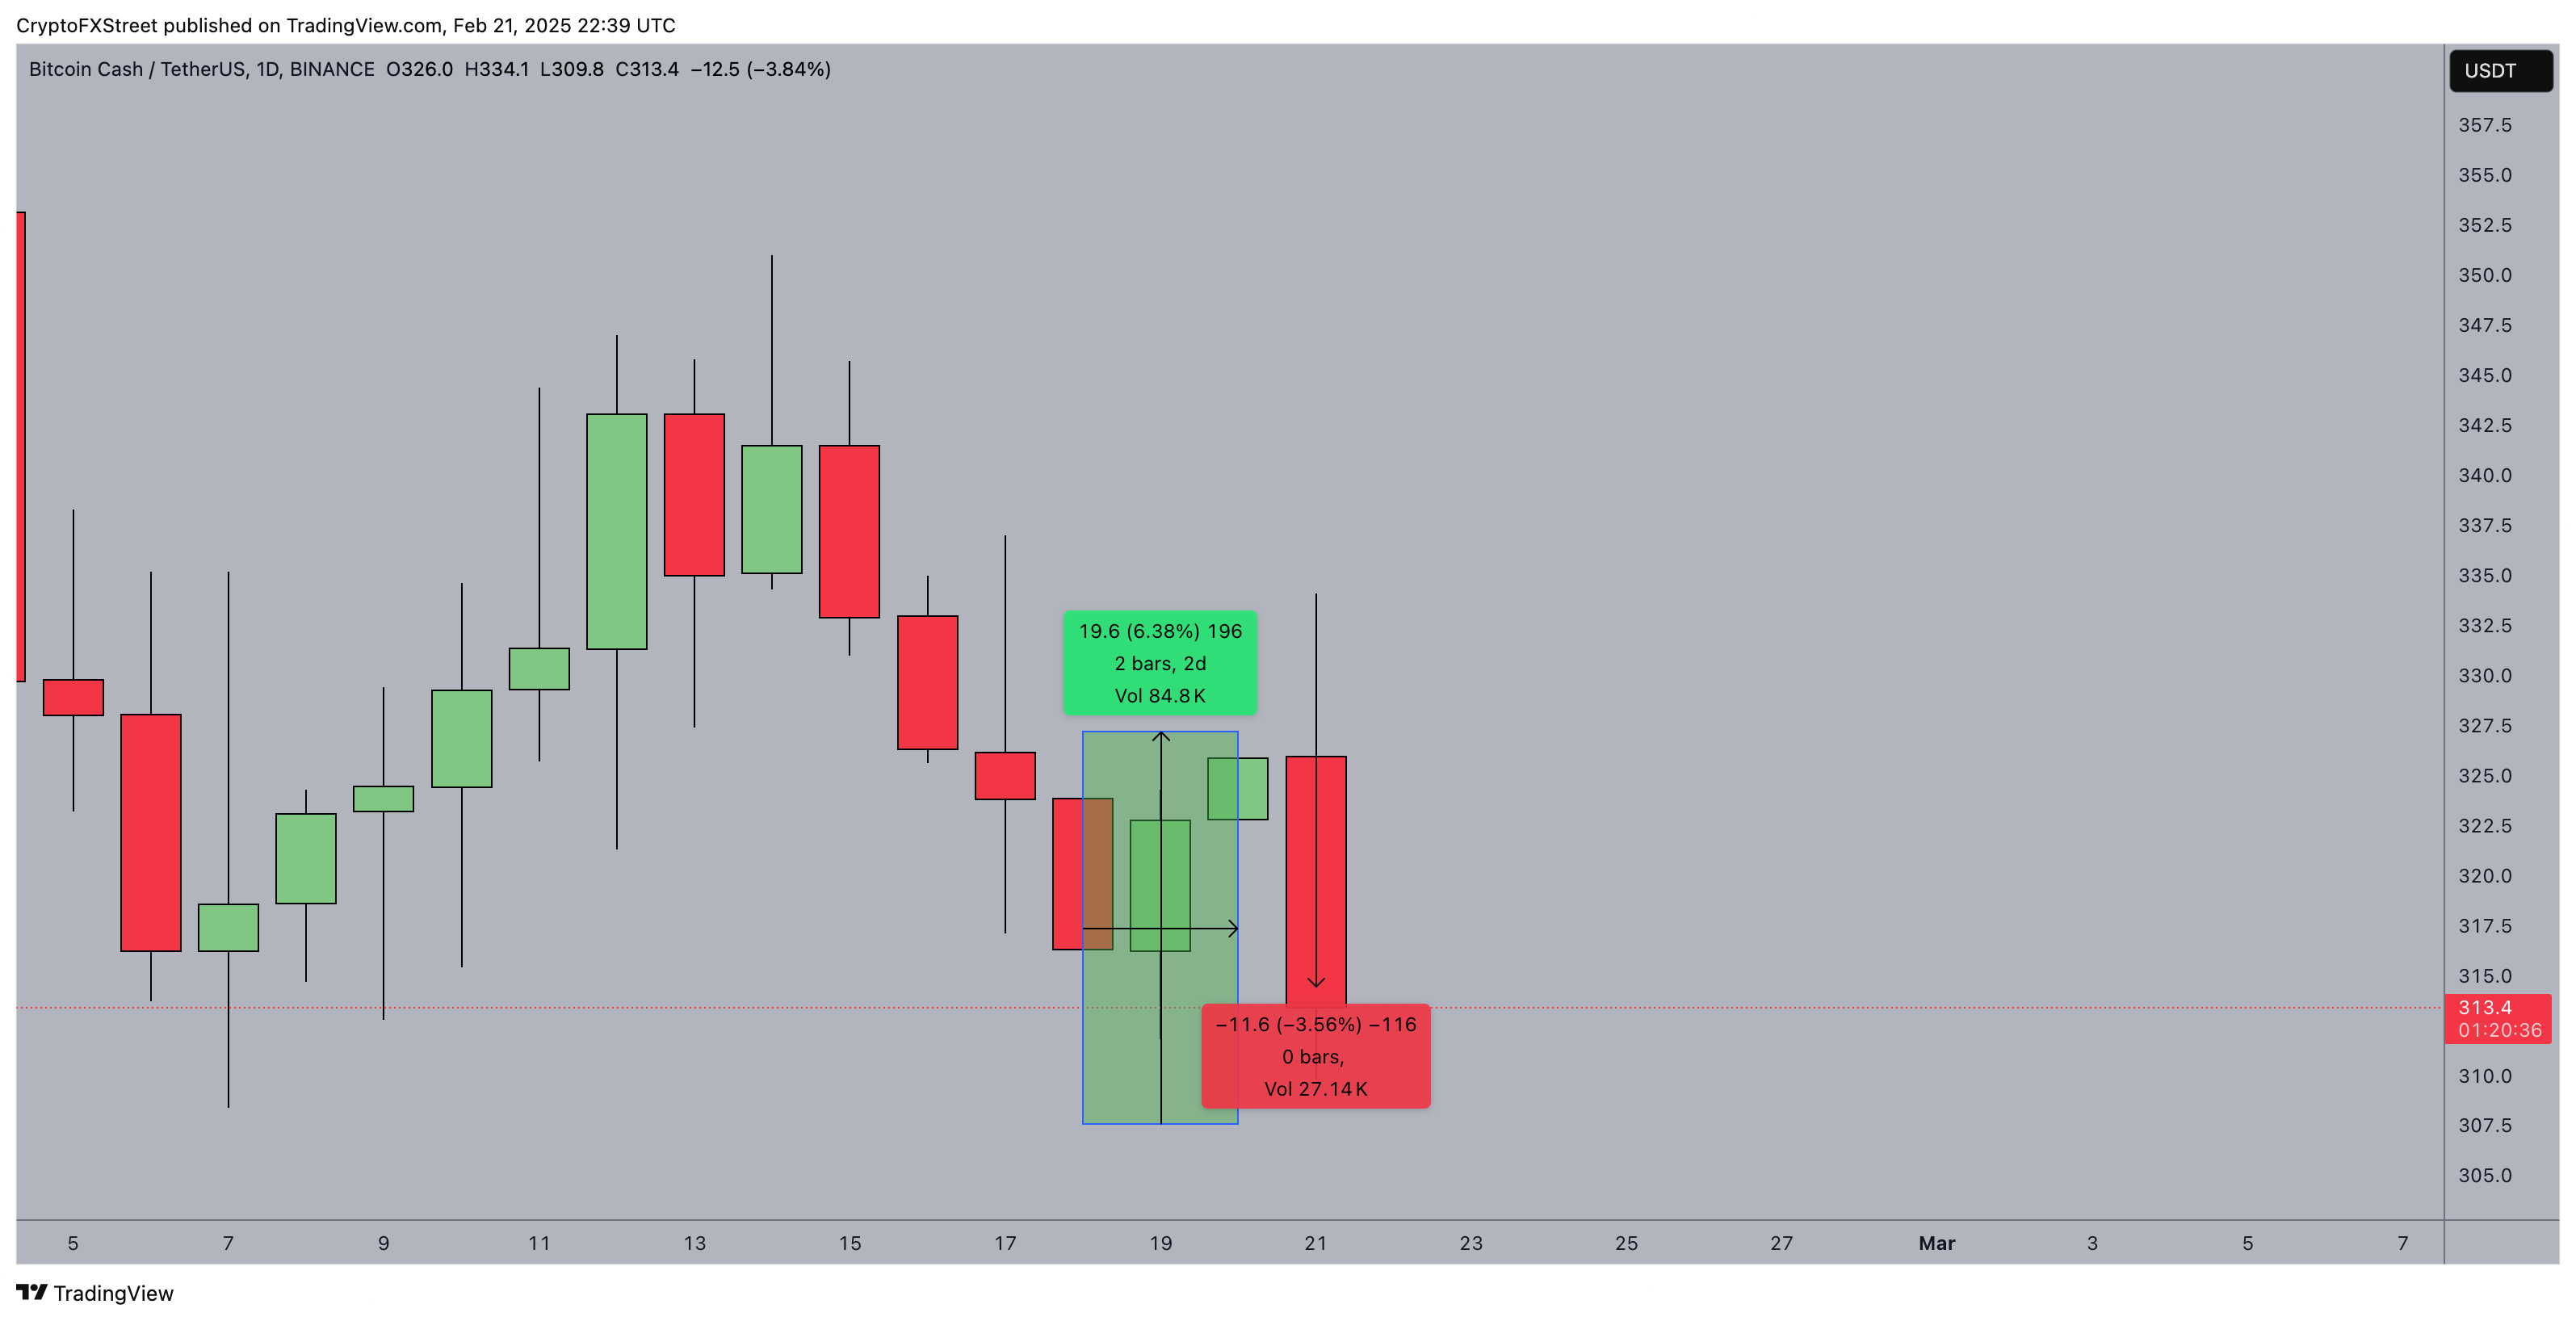
- Bitcoin Cash (BCH) price rose 6% before facing a 4% rejection from the $330 mark on Friday.
- BCH average transaction size has plunged by 67% since Feb. 3, while Litecoin’s rose 35% in the same period.
- The divergence between LTC and BCH whale demand trends suggests ETF buzz has shifted investor focus considerably this month.
Bitcoin Cash (BCH) price rose 6% before retracing 4% to hit the $318 mark on Friday. On-chain data trends suggest whale investors might be dumping BCH for LTC amid rising speculations on ETF approval prospects.
Bitcoin Cash (BCH) rebound 8% as SEC’s ETF confirmations revived altcoin market demand
Bitcoin Cash posted considerable gains this week, fueled by positive sentiment within the global altcoin market. The U.S. Securities and Exchange Commission (SEC) played a pivotal role in reviving demand within the altcoin markets.
After a turbulent start to February, markets found major relief when the SEC confirmed filings for Litecoin (LTC) and Ripple (XRP) ETF proposals from Grayscale. This week, the SEC acknowledged another filing from Bitwise for a Litecoin ETF. As investors priced in a 90% chance of LTC ETF approval, demand for other Proof-of-Work altcoins, including Bitcoin Cash (BCH), surged.
Bitcoin Cash (BCH) Price Action
Bitcoin Cash saw an 8% rally over two consecutive days, climbing to $330 before facing a 4% correction towards the $320 level on Friday.
However, despite this short-term recovery, broader market trends suggest BCH could face resistance in sustaining its momentum as ETF-driven capital shifts elsewhere.
Crypto whales are dumping BCH for LTC amid ETF hype
Bitcoin Cash (BCH) has underperformed relative to altcoins with active ETF filings. On-chain data now reveals that BCH could face more downside risks ahead as investors appear to be shifting funds toward Litecoin.
Validating this narrative, IntoTheBlock’s Average Transaction Size metric, which measures the dollar value of all transactions executed in a day divided by the total number of transactions, offers insight into shifts in whale demand.
A declining average transaction size typically indicates that large investors are reducing exposure.
-638757758596575068.png) Bitcoin Cash (BCH) vs Litecoin (LTC) Average transaction size | February 2025 | Source: IntoTheBlock
Bitcoin Cash (BCH) vs Litecoin (LTC) Average transaction size | February 2025 | Source: IntoTheBlock
Since Feb. 3, Bitcoin Cash’s average transaction size has plummeted by 67%, dropping from $36,870 to $15,388 as of Feb. 18.
Meanwhile, on Feb. 8—before the SEC acknowledged new altcoin ETF filings—Litecoin’s average transaction size stood at $45,190.
As ETF speculation intensified, this metric surged to $60,974 by Wednesday, marking a 35% increase during that period.
This trend suggests that institutional investors are pivoting towards assets with pending ETF approvals, either to front-run potential gains from the imminent approval or because the SEC’s acknowledgment provides regulatory clarity for those assets.
With BCH whale demand evidently in decline, the resulting drop in market liquidity means Bitcoin Cash price could struggle to sustain its current uptrend within the prevailing market dynamics.
Declining transaction sizes indicate weakened conviction from institutional buyers, making a sustained breakout unlikely in the near term.
Given the clear divergence between BCH and LTC whale demand, Bitcoin Cash price could struggle to regain bullish momentum above $350 unless a new fundamental catalyst emerges.
Bitcoin Cash Price Forecast: Double-Death Cross Signal Could Trigger Breakdown Below $300
Bitcoin Cash price remains in a precarious position as shifting capital flows favor altcoins with direct ETF catalysts. Until whale demand stabilizes, BCH faces downside risks that could cap its upside potential in the short to mid-term.
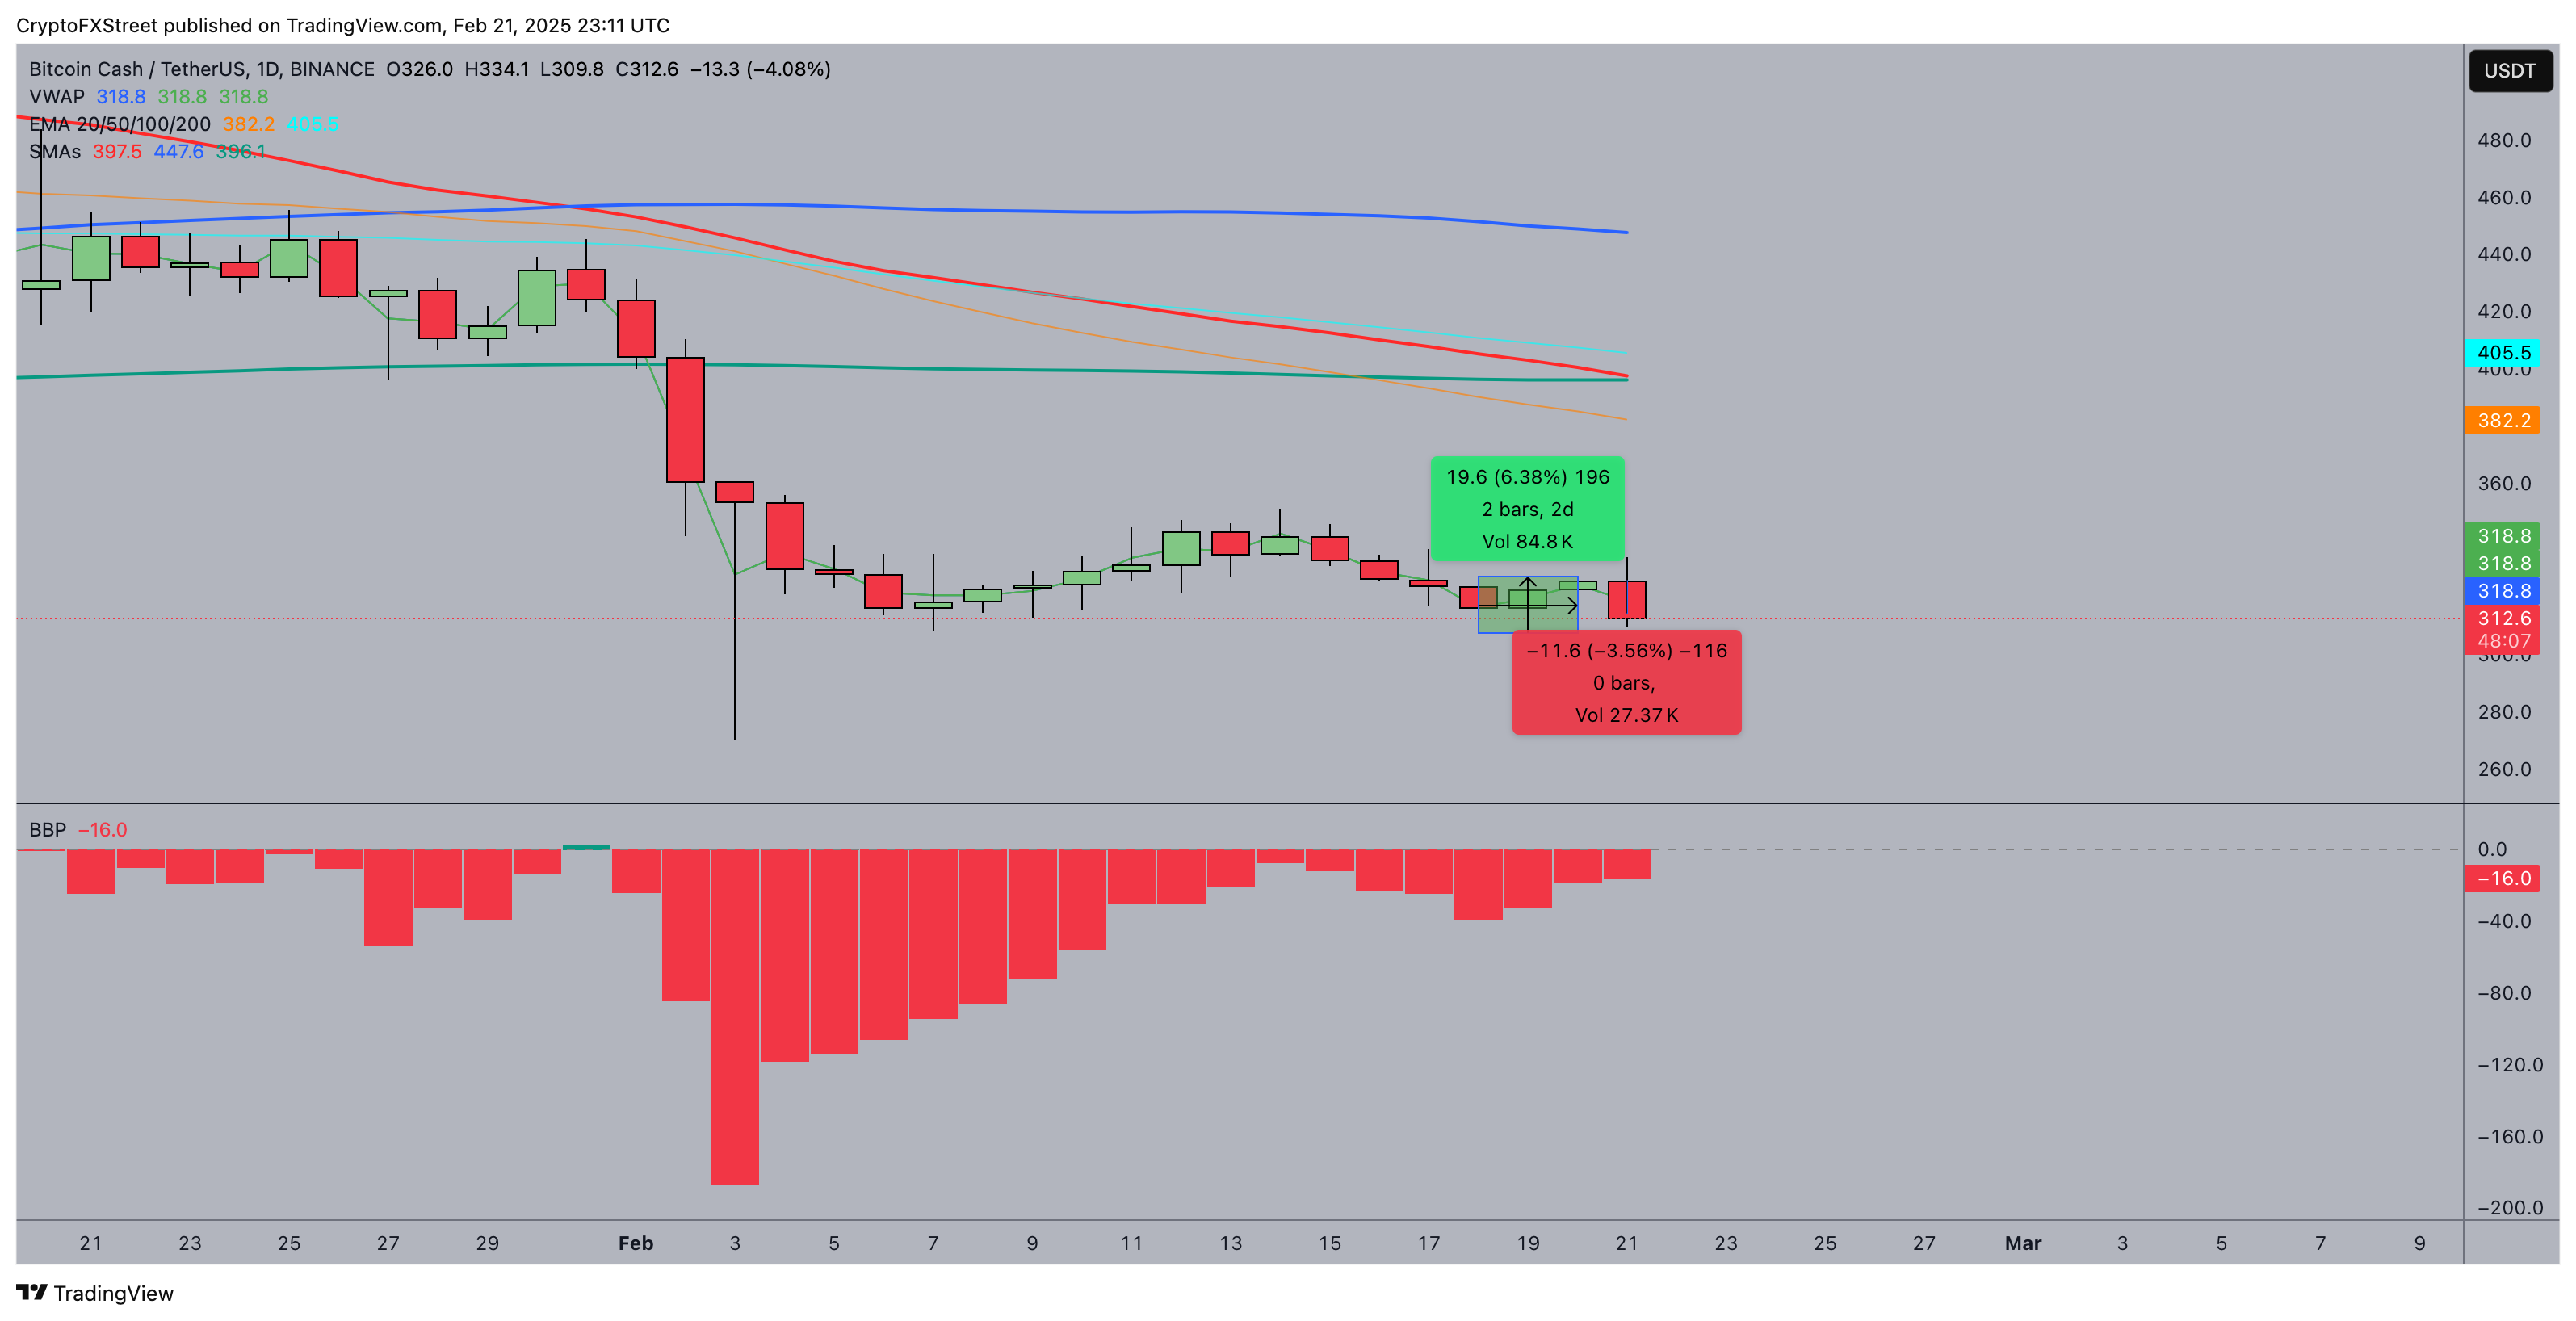
From a technical standpoint, Bitcoin Cash price forecast leans cautiously bearish as technical indicators highlight growing downside risks.
After an 8% rebound attempt to reclaim the $330 level, BCH has since faced a 4% retracement on Friday, currently trading at $313.8. The downtrend threatens to intensify as the 50-day Simple Moving Average (SMA) nears a critical bearish crossover with the 200-day SMA, forming a potential “double death cross” setup.
Bitcoin Cash Price Forecast
Notably, BCH already experienced a significant bearish signal on February 3 when the 50-day SMA crossed beneath the 100-day SMA, triggering a sharp price decline. BCHUSD daily price chart shows another major technical breakdown could be underway as the 50-day SMA approaches the 200-day SMA from above.
If this cross materializes, it would confirm a prolonged bearish structure, historically associated with extended downturns.
On the momentum front, the Bull-Bear Power (BBP) indicator remains in deep negative territory at -16.4, suggesting that bearish momentum still outweighs buying pressure.
A sustained break below the psychological $300 level could open the floodgates for further losses, potentially retesting February’s $280 lows.
Conversely, BCH must reclaim the $320-$330 range to negate the bearish outlook, with a close above the 50-day SMA potentially invalidating the double death cross narrative.