Products You May Like
- Gold finds support at $2,630 but remains capped ahead of the Fed’s decision.
- The market is bracing for a Fed “hawkish cut” that might boost the US Dollar and weigh on Gold.
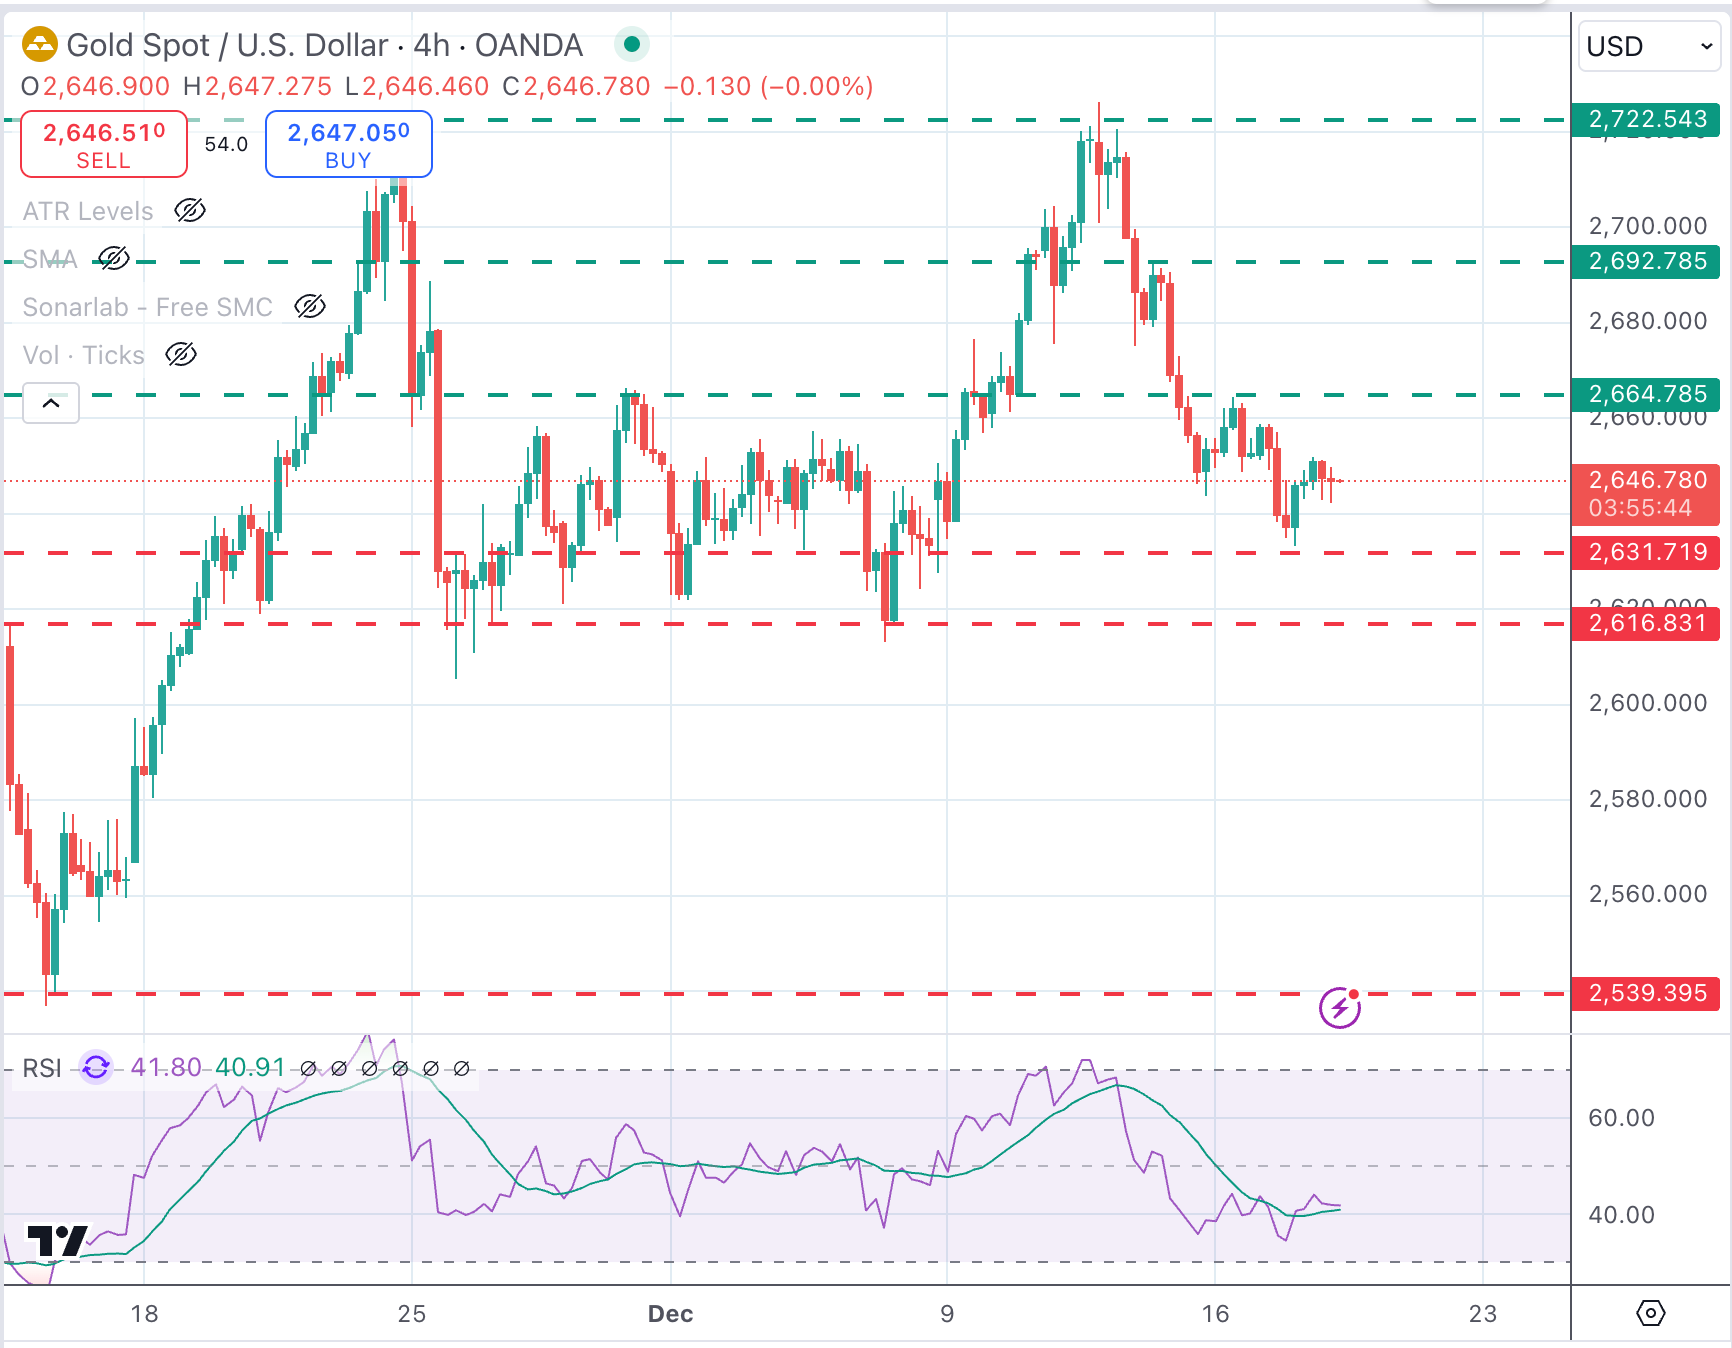
- XAU/USD remains under pressure, with upside attempts capped below $2,665.
Gold (XAU/USD) is practically flat on Wednesday after bouncing up from a one-week low the previous day. The precious metal remains on the defensive as the market braces for the outcome of the last Federal Reserve’s (Fed) meeting of the year.
The Fed is widely expected to cut interest rates by 25 basis points (bps), but the economic and rate hike projections will likely reveal a hawkish turn on the central bank’s forward guidance.
Recent US data shows that economic activity remains robust, consumption is buoyant, and inflationary pressures are high. Beyond that, US President-elect Donald Trump’s policies are expected to fuel price pressure higher.
This has forced investors to scale back monetary easing expectations, which is fuelling a sharp rebound in US Treasury yields and weighing on the yellow metal.
Gold remains vulnerable amid fears of a hawkish Fed
- US Retail Sales released on Tuesday revealed a 0.7% increment in November, up from an upwardly revised 0.5% rise in October and beating expectations of a 0.5% increase.
- Consumption amounts to more than 60% of the US GDP, and these figures endorse the view of US economic exceptionalism in the context of a global economic slowdown.
- US data released earlier this week showed an unexpected improvement in services activity, pointing to healthy economic growth in the fourth quarter.
- Futures markets are almost fully pricing a 25 bps interest rate cut on Wednesday, according to the CME Group’s FedWatch Tool, but less than a 30% chance of more than two quarter-percentage cuts in 2025.
Technical analysis: XAU/USD consolidates losses with upside attempts limited below $2,665
Gold has found some support at $2,630 and is consolidating recent losses, with investors looking from the sidelines ahead of the Fed decision. The short-term bearish trend, however, remains intact, with resistance at $2,665 capping upside attempts.
From a wider perspective, a potential double top at $2,720 suggests that a deeper correction is on the cards.
Immediate support is at $2,630 (December 17 low), while the $2,615-$2,605 area (November 25 and 26 lows) is the neckline of the previously mentioned double top. Below there, the next target would be November’s trough, at $2,540. On the upside, resistances are at the mentioned $2,665 (December 16 high) and 2,690 (December 13 high).
XAU/USD 4-Hour Chart

Dot Plot FAQs
The “Dot Plot” is the popular name of the interest-rate projections by the Federal Open Market Committee (FOMC) of the US Federal Reserve (Fed), which implements monetary policy. These are published in the Summary of Economic Projections, a report in which FOMC members also release their individual projections on economic growth, the unemployment rate and inflation for the current year and the next few ones. The document consists of a chart plotting interest-rate projections, with each FOMC member’s forecast represented by a dot. The Fed also adds a table summarizing the range of forecasts and the median for each indicator. This makes it easier for market participants to see how policymakers expect the US economy to perform in the near, medium and long term.
The US Federal Reserve publishes the “Dot Plot” once every other meeting, or in four of the eight yearly scheduled meetings. The Summary of Economic Projections report is published along with the monetary policy decision.
The “Dot Plot” gives a comprehensive insight into the expectations from Federal Reserve (Fed) policymakers. As projections reflect each official’s projection for interest rates at the end of each year, it is considered a key forward-looking indicator. By looking at the “Dot Plot” and comparing the data to current interest-rate levels, market participants can see where policymakers expect rates to head to and the overall direction of monetary policy. As projections are released quarterly, the “Dot Plot” is widely used as a guide to figure out the terminal rate and the possible timing of a policy pivot.
The most market-moving data in the “Dot Plot” is the projection of the federal funds rate. Any change compared with previous projections is likely to influence the US Dollar (USD) valuation. Generally, if the “Dot Plot” shows that policymakers expect higher interest rates in the near term, this tends to be bullish for USD. Likewise, if projections point to lower rates ahead, the USD is likely to weaken.
