Products You May Like
EUR/USD Current price: 1.0773
- The Federal Reserve will announce its decision on monetary policy later in the day.
- The outcome of the US presidential election keeps affecting financial boards.
- The EUR/USD pair trimmed part of its recent losses, bullish potential remains limited.

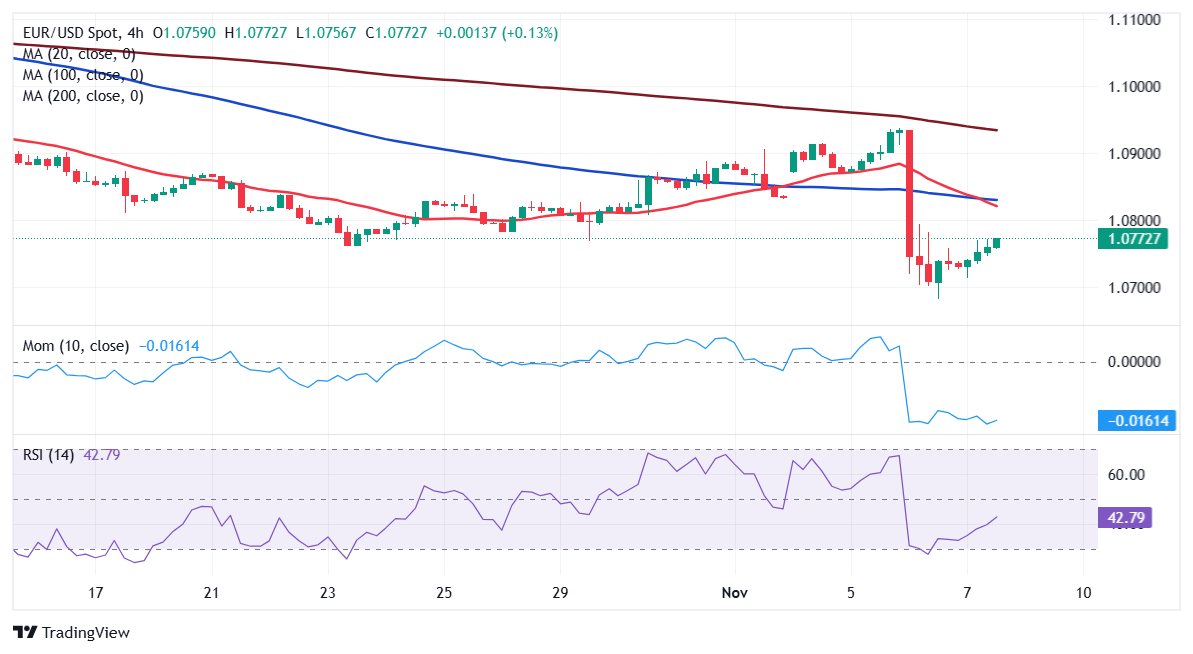
The EUR/USD pair managed to trim part of the US election-inspired losses and trades at around 1.0773. Former United States (US) President Donald Trump achieved an overwhelming victory in the 2024 election. Trump clinched 295 electoral votes against the 226 received by his opponent, Kamala Harris, also securing control of the Senate. As a result, the US Dollar run alongside stock markets.
As the dust settled, investors turned their eyes to the Federal Reserve (Fed). The central bank will announce its decision on monetary policy in the American afternoon, and is widely anticipated to trim the benchmark interest rate by 25 basis points (bps). The focus, however, will be on comments from Chairman Jerome Powell, who will offer a press conference after announcing the decision. The new political scenario will probably be the main theme.
Data-wise, Germany reported that Industrial Production declined by 2.5% in September, worse than the -1% anticipated. On a yearly basis, Industrial Production fell 4.6%. Additionally, the Eurozone published September Retail Sales, which printed at 0.5% MoM, below the previous revised 1.1% but better than the 0.4% anticipated. The annual figure also beat expectations, hitting 2.9%.
The US will publish the usual weekly unemployment claims figures, and the preliminary estimates of Q3 Nonfarm Productivity and Unit Labor Costs. As said, however, the focus will be on the Fed.
EUR/USD short-term technical outlook
The daily chart for the EUR/USD pair shows the advance is just corrective. The pair keeps developing above all its moving averages, with the 20 Simple Moving Average (SMA) heading firmly south below directionless 100 and 200 SMAs. Technical indicators, in the meantime, have lost their downward strength but hold well within negative levels, ticking marginally higher amid the ongoing recovery, yet not enough to suggest growing buying interest.
In the near term, and according to the 4-hour chart, the technical picture is similar. Technical indicators bounced from oversold readings, heading north but well below their midlines. It seems to reflect the correction rather than suggest another leg higher. Finally, the 20 SMA gains downward momentum, and is crossing below an also bearish 100 SMA, in line with the dominant selling interest.
Support levels: 1.0700 1.0665 1.0630
Resistance levels: 1.0800 1.0840 1.0885
