
Products You May Like
- Ethereum is outperforming cryptocurrencies in the top 20 since the Fed reduced rates.
- The top altcoin’s 16% rise comes after months of underperforming Bitcoin and Solana.
- Ethereum overcame the $2,595 resistance as traders set sights on the $2,817 key level.
Ethereum (ETH) is up nearly 4% on Monday following its impressive rally in the past five days since the Federal Reserve (Fed) cut rates by 50 basis points. ETH is currently attempting to reclaim a key support level at $2,817.
Daily Digest Market Movers: Ethereum’s 16% rise and open interest growth
Ethereum has put up a strong performance against Bitcoin and other top 20 cryptocurrencies by market capitalization since the Federal Reserve (Fed) reduced interest rates by 50 basis points on Wednesday. In the past five days since the cut, the top altcoin has risen by over 16%, while Bitcoin and Solana have only managed gains of 7% and 10%, respectively.
The rally is also supported by ETH’s rising open interest (OI) in the past week. Open interest is the total number of unsettled long and short contracts in a derivatives market.
ETH’s OI crossed $12.37 billion at press time and is approaching levels last seen before the market crash in early August, per Coinglass data. Rising open interest, alongside price increases, suggests confidence among investors.
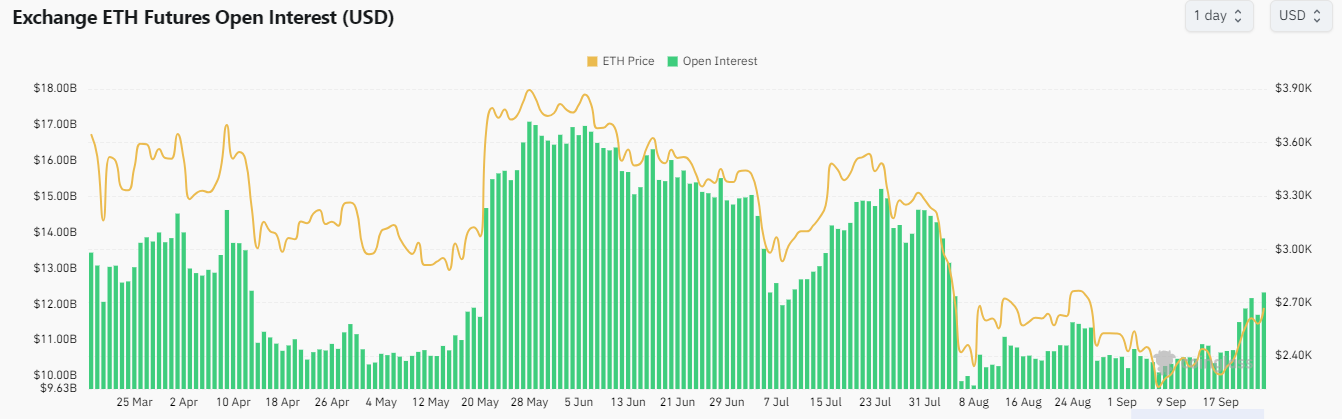
ETH Open Interest
ETH’s rise comes after months of underperforming Bitcoin and Solana. The ETH/BTC ratio notably reached a low last seen in April 2021 earlier last week.
Bitfinex analysts noted in a report released on Monday that ETH’s recent outperformance is due to the “extreme depression in altcoin valuations and open interest that has been observed since March 2024.” However, the analysts also noted that the increased open interest signals the potential for heightened volatility in the altcoin market, which ETH leads.
Meanwhile, Ethereum exchange-traded funds (ETF) posted $28.5 million in net outflows last week despite ending the week with inflows, per CoinShares data.
Ethereum targets $2,817 following move above upper rectangle boundary
Ethereum is trading around $2,670 on Monday, up 3.7% on the day. In the past 24 hours, ETH has seen over $37 million in liquidations, with long and short liquidations accounting for $16.06 million and $21.39 million, respectively.
On the 4-hour chart, the top altcoin overcame the $2,595 rectangle’s resistance over the weekend and is attempting a move to retest the $2,817 key price level.
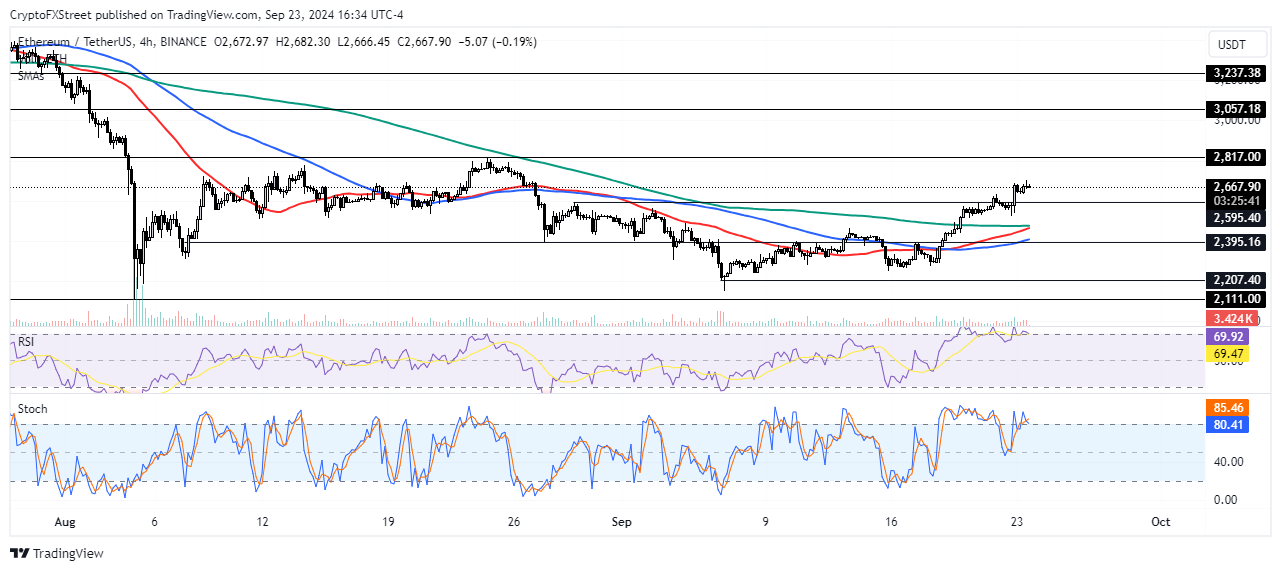
ETH/USDT 4-hour chart
A successful move above this level could help the bullish momentum, considering the $2,817 price level has previously established itself as critical support between April and August. Such a move would see ETH cross above the $3,000 psychological level and target the next resistance at $3,057.
However, a decline below the $2,595 level could cause ETH to sustain a correction toward the $2,395 support level.
The Relative Strength Index (RSI) and Stochastic Oscillator (Stoch) are attempting to move below their oversold region, indicating a potential price correction.
In the short term, ETH could rise to $2,706 to liquidate positions worth $56.35 million.
Cryptocurrency metrics FAQs
The developer or creator of each cryptocurrency decides on the total number of tokens that can be minted or issued. Only a certain number of these assets can be minted by mining, staking or other mechanisms. This is defined by the algorithm of the underlying blockchain technology. Since its inception, a total of 19,445,656 BTCs have been mined, which is the circulating supply of Bitcoin. On the other hand, circulating supply can also be decreased via actions such as burning tokens, or mistakenly sending assets to addresses of other incompatible blockchains.
Market capitalization is the result of multiplying the circulating supply of a certain asset by the asset’s current market value. For Bitcoin, the market capitalization at the beginning of August 2023 is above $570 billion, which is the result of the more than 19 million BTC in circulation multiplied by the Bitcoin price around $29,600.
Trading volume refers to the total number of tokens for a specific asset that has been transacted or exchanged between buyers and sellers within set trading hours, for example, 24 hours. It is used to gauge market sentiment, this metric combines all volumes on centralized exchanges and decentralized exchanges. Increasing trading volume often denotes the demand for a certain asset as more people are buying and selling the cryptocurrency.
Funding rates are a concept designed to encourage traders to take positions and ensure perpetual contract prices match spot markets. It defines a mechanism by exchanges to ensure that future prices and index prices periodic payments regularly converge. When the funding rate is positive, the price of the perpetual contract is higher than the mark price. This means traders who are bullish and have opened long positions pay traders who are in short positions. On the other hand, a negative funding rate means perpetual prices are below the mark price, and hence traders with short positions pay traders who have opened long positions.