
Products You May Like
- Bitcoin price approaches 200-day EMA support area of around $62,000 and could expect a bounce.
- US spot Bitcoin ETFs recorded inflows of $200.04 million on Monday.
- On-chain data shows negative exchange netflow and the long-to-short ratio above one, further giving chances for a bullish move.
Bitcoin (BTC) continues to retrace on Tuesday after declining by 2.2% on Monday as it faced rejection around the daily resistance level of $65,400. The largest crypto asset trades near its 200-day Exponential Moving Average (EMA) around $62,000, a level from which it could stage a rebound supported by technical analysis and positive on-chain data such as a negative exchange netflow and a long-to-short ratio above one.
Daily digest market movers: Bitcoin US spot ETFs record inflows
- Coinglass’s US spot Bitcoin ETFs data shows an inflow of $200.4 million on Monday. The spot EFTs have seen continuous inflows since August 15, the longest streak of gains since mid-July. Monitoring these ETFs’ net flow data is crucial for understanding market dynamics and investor sentiment. The combined Bitcoin reserves held by the 11 US spot Bitcoin ETFs stand at $46.90 billion.
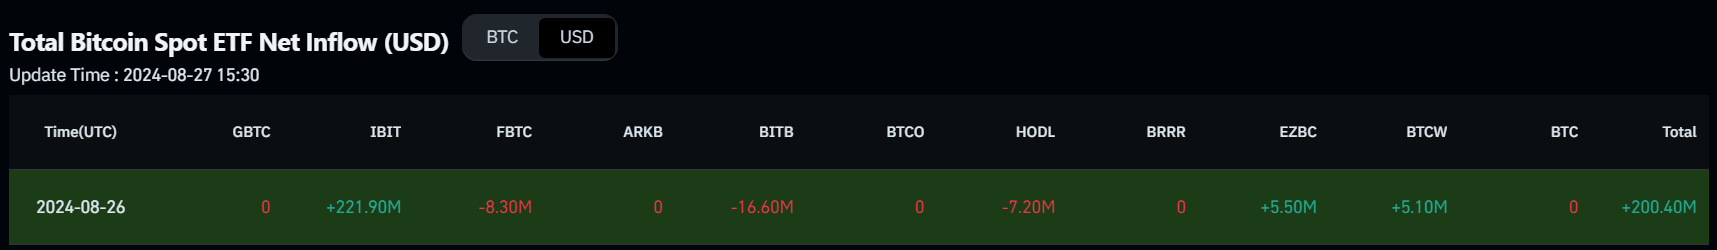
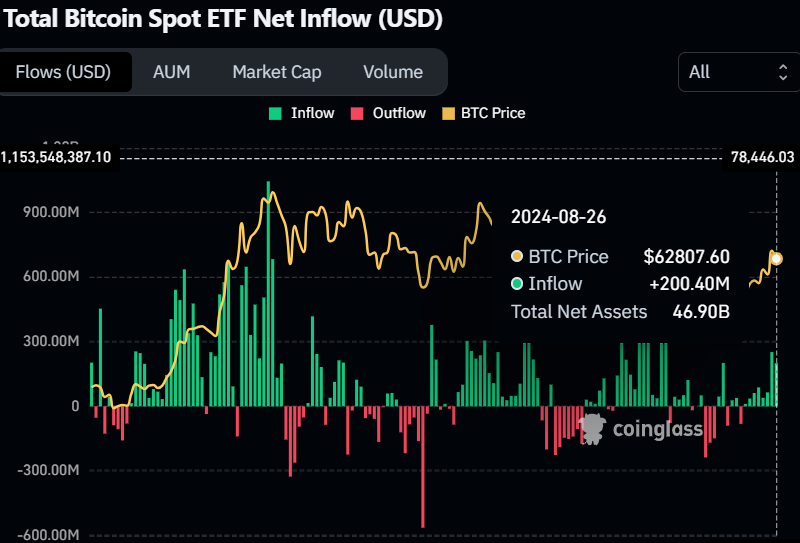
Bitcoin Spot ETF Net Inflow chart
- CryptoQuant Exchange Netflow data shows the difference between coins flowing into and out of exchanges. An increase in exchange inflows (a positive value) is mostly bearish, while the increase in outflows from exchanges (negative value) is mostly bullish. In BTC’s case, the netflow shows -45,500 BTC on Monday, indicating that 45,500 BTC were removed from exchanges and stored in the holders’ wallets, suggesting buying activity and reducing selling pressure.
%20-%20All%20Exchanges-638603585109047866.png)
BTC Exchange Netflow chart
- According to Coinglass’s data, BTC’s Binance long-to-short ratio is 1.33. This ratio reflects bullish sentiment in the market, as a number above one suggests that more traders anticipate the price of the asset to rise.
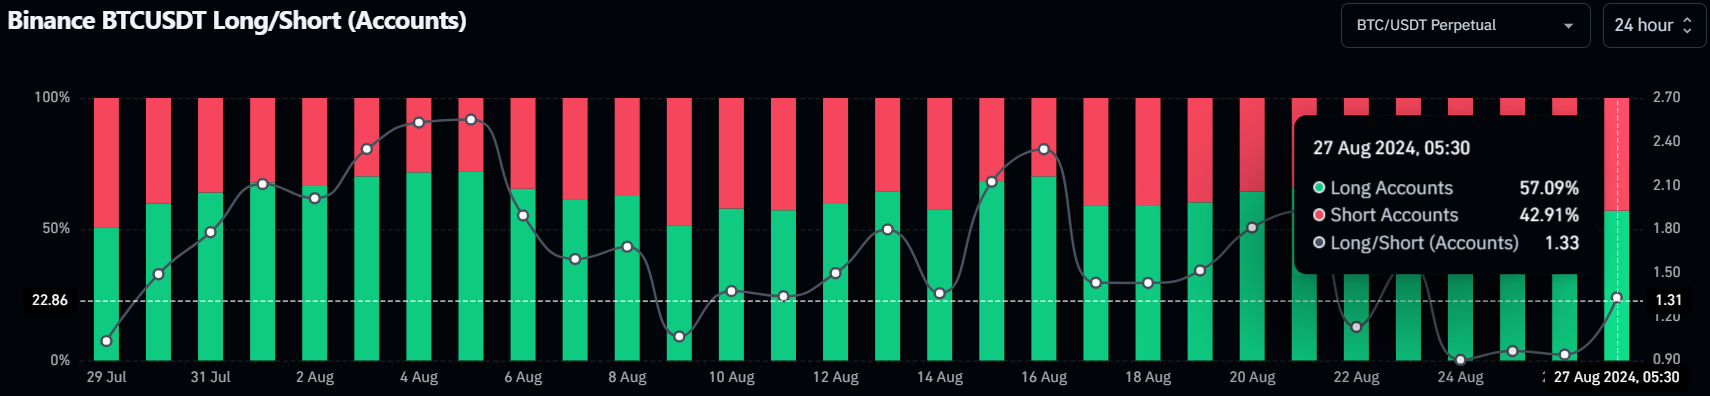
Binance BTC long-to-short ratio chart
Technical analysis: BTC price could rally if it retests 200-day EMA
Bitcoin price faced a pullback at around the daily resistance level of $65,379 on Sunday, declining 2.2% on Monday. At the time of writing on Tuesday, it continues to retrace down by 0.6% at $62,416.
If BTC continues to retrace, it could find support at the 200-day Exponential Moving Average (EMA) at $62,267.
If BTC bounces off $62,042, it could rise to $65,379 before potentially rallying by 7% to restest its July 29 high of $70,079.
This bounce is supported by indicators like the Relative Strength Index (RSI) and Awesome Oscillator (AO) on the daily chart, which sit comfortably above their respective mean levels of 50 and zero. These momentum indicators signal indecisiveness among investors.
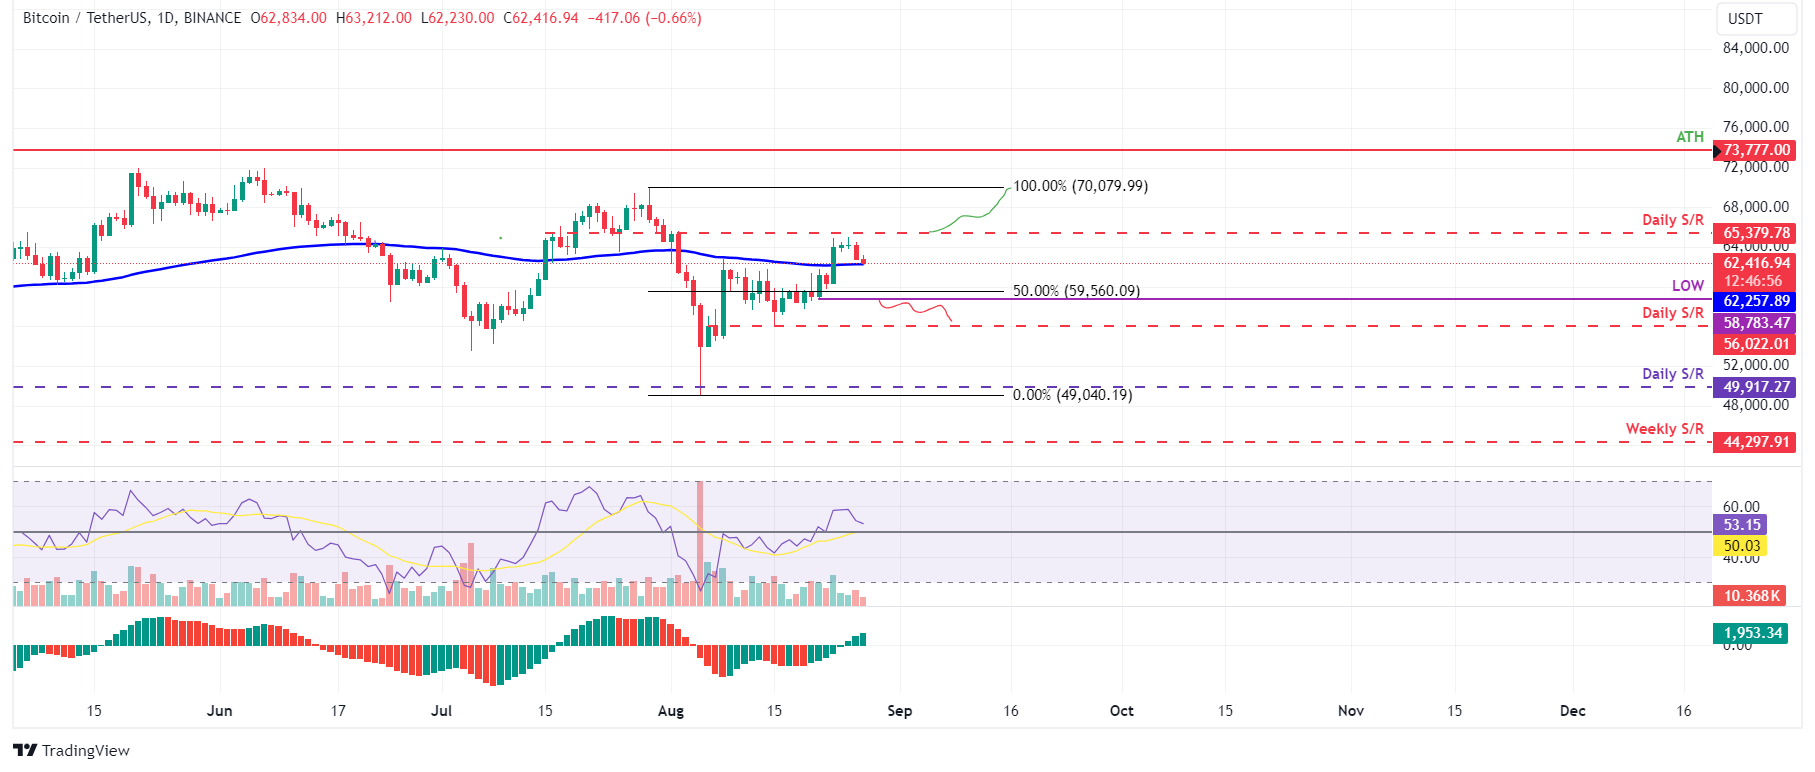
BTC/USDT daily chart
However, if Bitcoin’s price closes below the August 21 low of $58,783, a 5% decline towards daily support at $56,022 would be on the cards as it would set a lower low on the daily chart. This scenario would invalidate the bullish thesis.
Cryptocurrency metrics FAQs
The developer or creator of each cryptocurrency decides on the total number of tokens that can be minted or issued. Only a certain number of these assets can be minted by mining, staking or other mechanisms. This is defined by the algorithm of the underlying blockchain technology. Since its inception, a total of 19,445,656 BTCs have been mined, which is the circulating supply of Bitcoin. On the other hand, circulating supply can also be decreased via actions such as burning tokens, or mistakenly sending assets to addresses of other incompatible blockchains.
Market capitalization is the result of multiplying the circulating supply of a certain asset by the asset’s current market value. For Bitcoin, the market capitalization at the beginning of August 2023 is above $570 billion, which is the result of the more than 19 million BTC in circulation multiplied by the Bitcoin price around $29,600.
Trading volume refers to the total number of tokens for a specific asset that has been transacted or exchanged between buyers and sellers within set trading hours, for example, 24 hours. It is used to gauge market sentiment, this metric combines all volumes on centralized exchanges and decentralized exchanges. Increasing trading volume often denotes the demand for a certain asset as more people are buying and selling the cryptocurrency.
Funding rates are a concept designed to encourage traders to take positions and ensure perpetual contract prices match spot markets. It defines a mechanism by exchanges to ensure that future prices and index prices periodic payments regularly converge. When the funding rate is positive, the price of the perpetual contract is higher than the mark price. This means traders who are bullish and have opened long positions pay traders who are in short positions. On the other hand, a negative funding rate means perpetual prices are below the mark price, and hence traders with short positions pay traders who have opened long positions.