
Products You May Like
- Bitcoin price breaks above the consolidation zone between $57,000 and $62,000, signaling an impending rally ahead.
- US spot Bitcoin ETFs recorded net inflows of $506.40 million last week.
- On-chain data shows positive funding rates and a decreasing Miners Position Index, further giving chances for a bullish move.
Bitcoin’s (BTC) price clings to gains on Monday after rising 10% last week and closing above $64,000. BTC price rallied on Friday, driven by Federal Reserve (Fed) Chairman Jerome Powell’s confirmation that an interest-rate cut in the US is coming in September. This positive market sentiment led US spot Bitcoin ETFs to register net inflows of more than $500 million last week, while on-chain data such as the decreasing Miners Position Index and positive funding rates suggest a bullish outlook.
Daily digest market movers: Powell supports Bitcoin
- Fed Chair Jerome Powell opened the door on Friday to an interest-rate cut in the US after the central bank’s next policy meeting scheduled for September 17-18. Lower interest rates tend to support risk assets such as cryptocurrencies. Expectations of lower rates propelled Bitcoin price to a high of $64,955 on Friday, a level that broadly held up during the weekend.
- Coinglass’s US spot Bitcoin ETFs data shows that on Friday, it recorded an inflow of $252 million, the highest single-day inflow since July 22. Monitoring these ETFs’ net flow data is crucial for understanding market dynamics and investor sentiment. The combined Bitcoin reserves held by the 11 US spot Bitcoin ETFs stand at $44.60 billion.
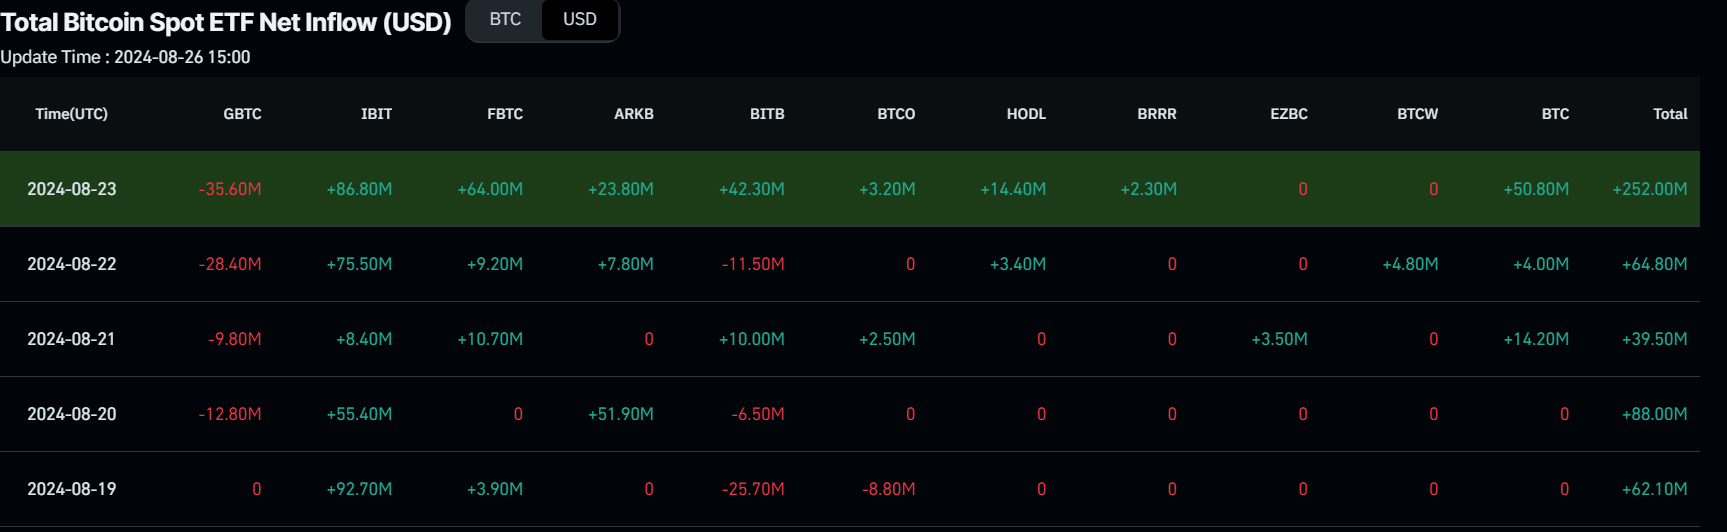
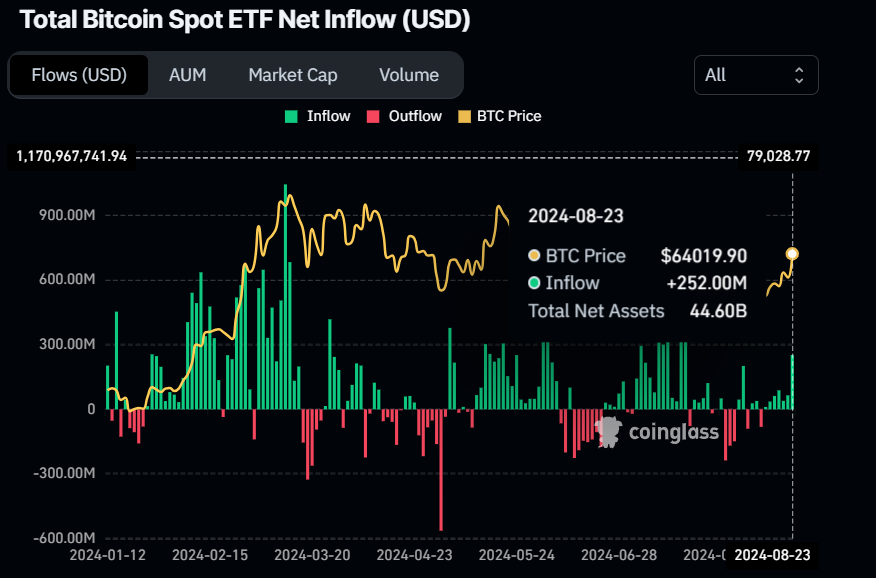
Bitcoin Spot ETF Net Inflow chart
- Cryptoquant’s Miners Position Index (MPI), which is the ratio of the number of miners’ outflows in USD divided by the 365-day moving average, presents a bullish price outlook for Bitcoin. If the metric increases, miners become more active in selling, increasing the selling pressure and thereby decreasing Bitcoin’s price. On the contrary, a decrease in the index suggests miners are becoming less involved in selling. In BTC’s case, the metric decreases from -0.63 to -1.46 from Friday to Monday, suggesting less selling pressure.
-638602714311797502.png)
Bitcoin Miners Position Index chart
- CryptoQuant’s funding rates, a key indicator gauging futures market sentiment, is also positive for Bitcoin’s price outlook. Funding rates represent traders’ sentiments in the perpetual swaps market and are proportional to the number of contracts. Positive funding rates indicate that long-position traders are dominant, while negative funding rates indicate that short-position traders are dominant and are willing to pay long traders. As for BTC’s case, the funding rates are positive and stand at 0.008, reflecting bullish sentiment and buyer dominance. t.
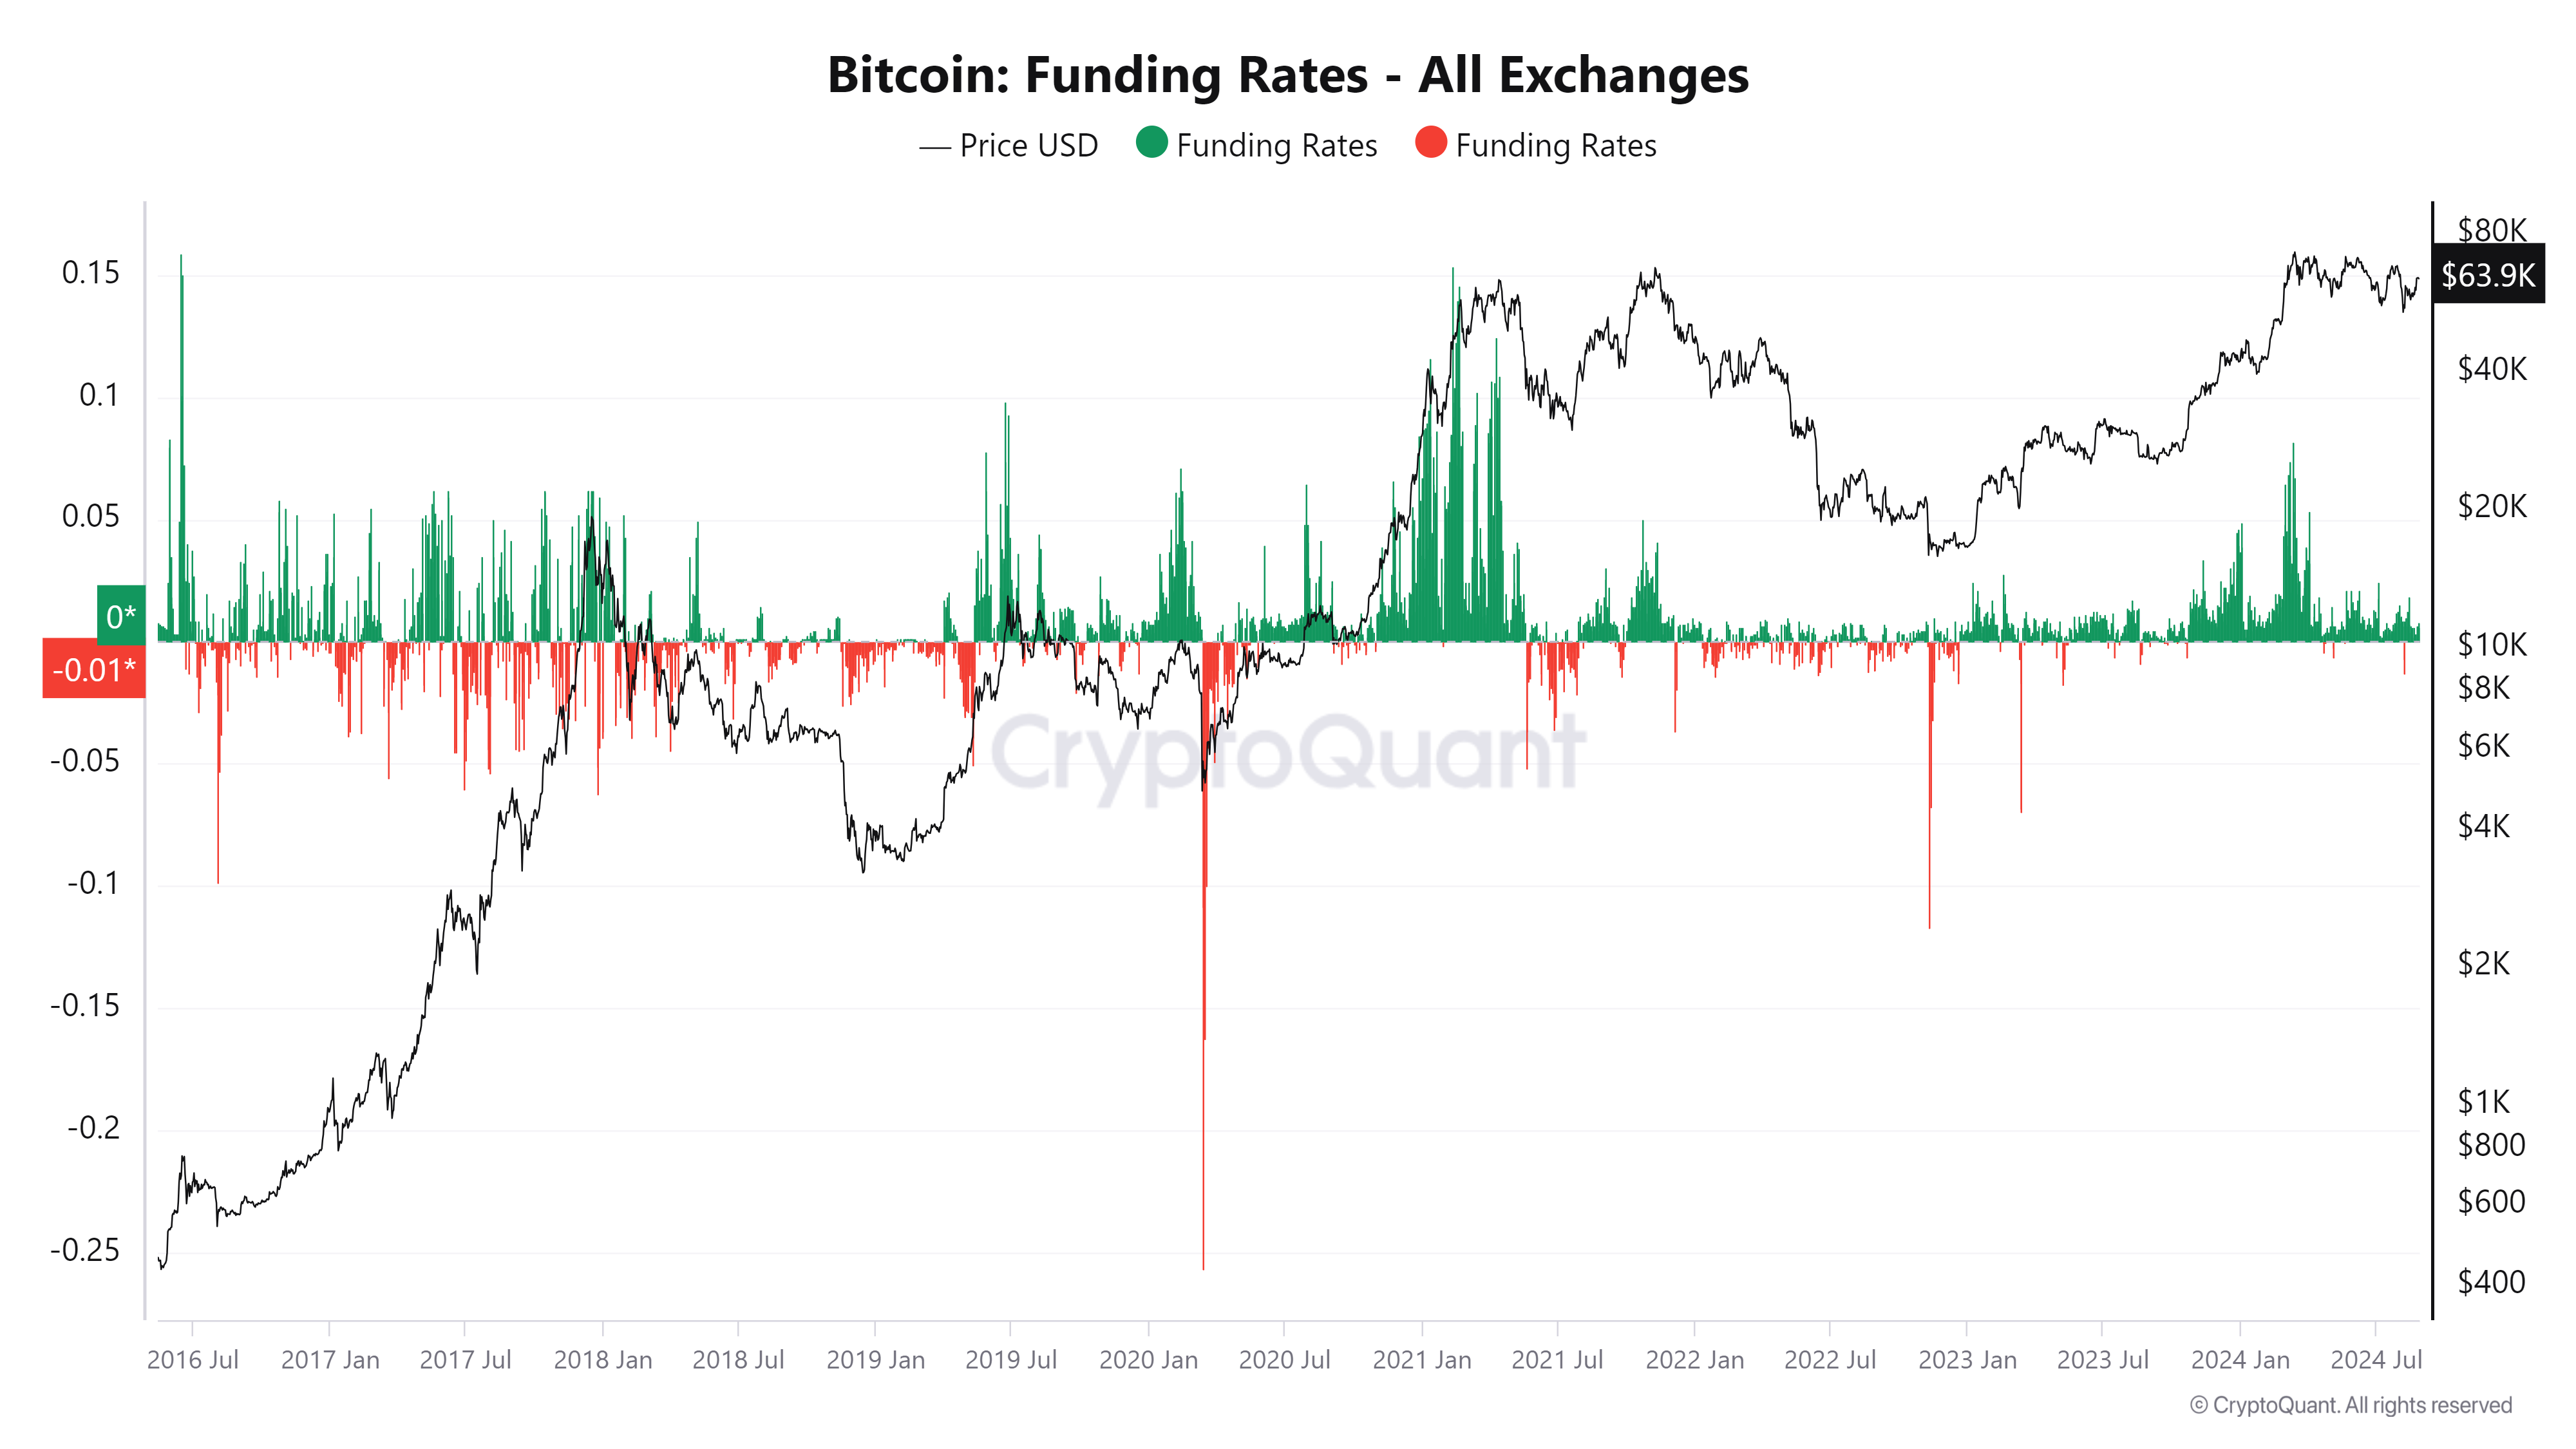
Bitcoin Funding rates chart
Technical analysis: BTC price breaks above the 200-day EMA
Bitcoin price broke above its resistance level, the 200-day Exponential Moving Average (EMA) at $62,280 and its 61.8% Fibonacci retracement level (drawn from the high on July 29 to the low on August 5) at $62,042 on Friday. At the time of writing on Monday, it is slightly down 0.3% at $64,021.
If the 200-day EMA at $62,280 holds as support and BTC closes above the $65,596 level, it could rally 7% to restest its July 29 high of $70,079.
This bounce is supported by indicators like the Relative Strength Index (RSI) and Awesome Oscillator (AO) on the daily chart, which sit comfortably above their respective mean levels of 50 and zero. These momentum indicators strongly indicate bullish dominance.
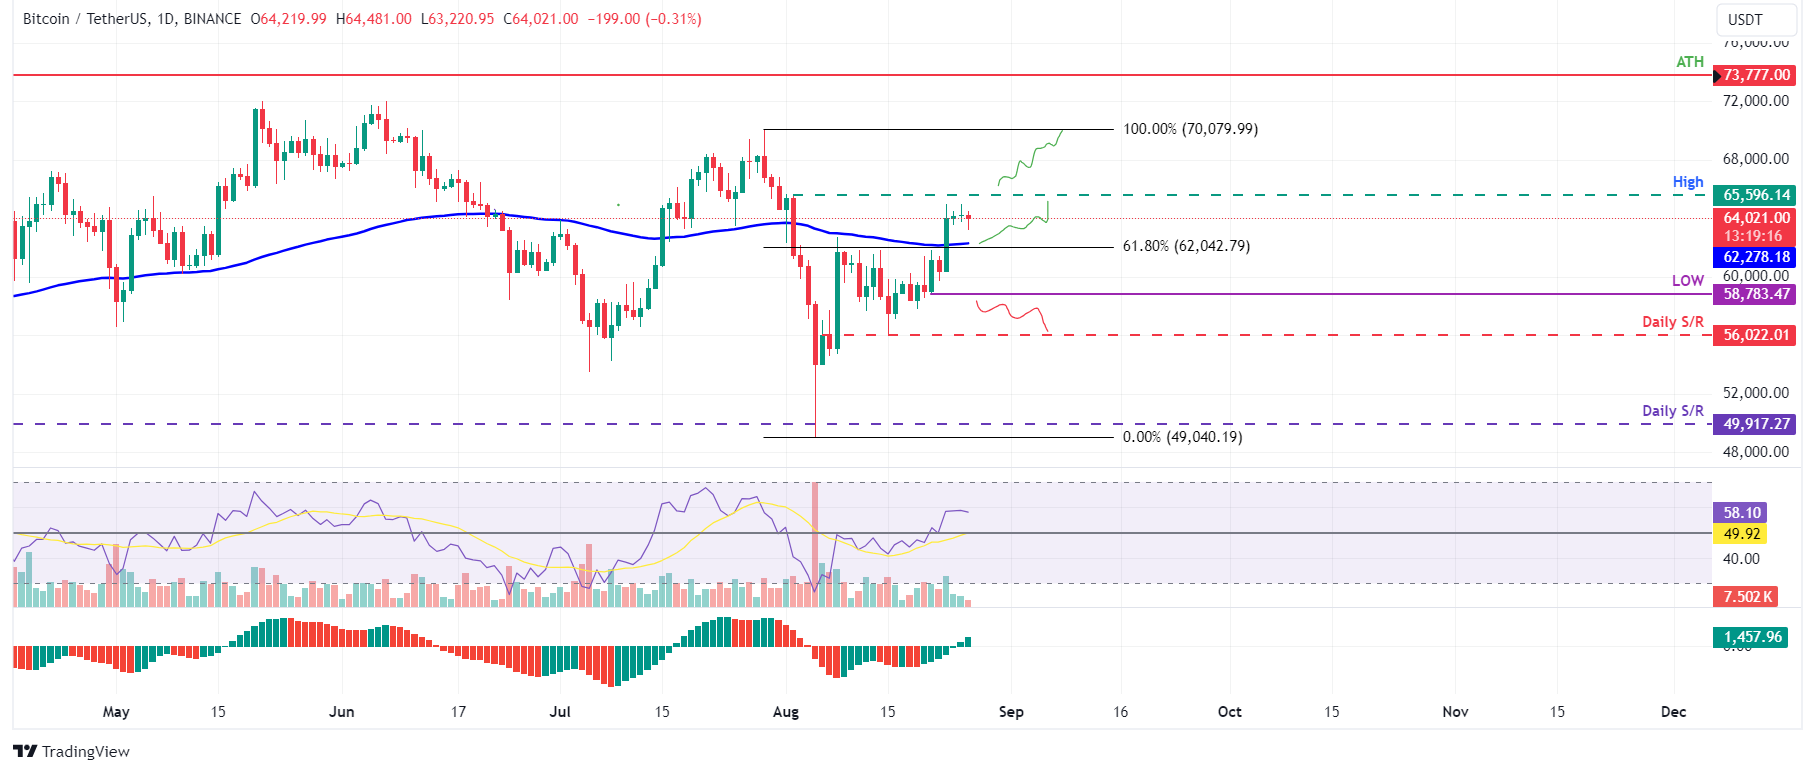
BTC/USDT daily chart
However, if Bitcoin’s price closes below the August 21 low of $58,783, a 5% decline towards daily support at $56,022 would be on the cards, as it would set a lower low on the daily chart. Thus invalidating the bullish thesis.
The developer or creator of each cryptocurrency decides on the total number of tokens that can be minted or issued. Only a certain number of these assets can be minted by mining, staking or other mechanisms. This is defined by the algorithm of the underlying blockchain technology. Since its inception, a total of 19,445,656 BTCs have been mined, which is the circulating supply of Bitcoin. On the other hand, circulating supply can also be decreased via actions such as burning tokens, or mistakenly sending assets to addresses of other incompatible blockchains.
Market capitalization is the result of multiplying the circulating supply of a certain asset by the asset’s current market value. For Bitcoin, the market capitalization at the beginning of August 2023 is above $570 billion, which is the result of the more than 19 million BTC in circulation multiplied by the Bitcoin price around $29,600.
Trading volume refers to the total number of tokens for a specific asset that has been transacted or exchanged between buyers and sellers within set trading hours, for example, 24 hours. It is used to gauge market sentiment, this metric combines all volumes on centralized exchanges and decentralized exchanges. Increasing trading volume often denotes the demand for a certain asset as more people are buying and selling the cryptocurrency.
Funding rates are a concept designed to encourage traders to take positions and ensure perpetual contract prices match spot markets. It defines a mechanism by exchanges to ensure that future prices and index prices periodic payments regularly converge. When the funding rate is positive, the price of the perpetual contract is higher than the mark price. This means traders who are bullish and have opened long positions pay traders who are in short positions. On the other hand, a negative funding rate means perpetual prices are below the mark price, and hence traders with short positions pay traders who have opened long positions.