
Products You May Like
EUR/USD Current price: 1.0725
- The German IFO Business Climate survey missed expectations in June.
- The better tone of Wall Street helped EUR/USD to stay afloat in the second half of the day.
- EUR/USD loses its upward steam, could pierce the 1.0700 threshold.
The EUR/USD pair saw little action on Monday, confined to a tight 50 pips range. The US Dollar found demand at the beginning of the day, resulting in the pair bottoming at 1.0681. It recovered, advancing with Wall Street up to 1.0745, where sellers reappeared. EUR/USD settled in the 1.0720 price zone, holding on to modest gains.
The macroeconomic calendar had little to offer, although Germany published the June IFO Business Climate survey, which unexpectedly fell to 88.6 from 89.3 in May, missing the 89.7 expected. The assessment of the current situation and expectations sub-indexes also missed the market’s estimates. Across the pond, the United States (US) unveiled the Dallas Fed Manufacturing Business Index, which improved to -15.1 in June from -19.4 in the previous month.
In the absence of significant headlines, major pairs followed stock markets, which reflected the market mood. Following a cautious stance in Asia, markets seemed more optimistic after the American opening, as the three major US indexes posted gains.
On Tuesday, the Eurozone macroeconomic calendar will have little to offer, while the US will publish housing-related figures and June CB Consumer Confidence. The latter is foreseen at 100.0, contracting from the previous 102.0. Later in the week, investors will look at the Federal Open Market Committee (FOMC) meeting Minutes and the US Personal Consumption Expenditures (PCE) Price Index.
EUR/USD short-term technical outlook
The daily chart for the EUR/USD pair shows further advances seem unlikely. The pair remains below all its moving averages, with a bearish 20 Simple Moving Average (SMA) crossing below directionless 100 and 200 SMAs, all of them in the 1.0780/90 price zone. At the same time, technical indicators have barely recovered from near oversold readings, maintaining modest upward slopes, although far below their midlines.
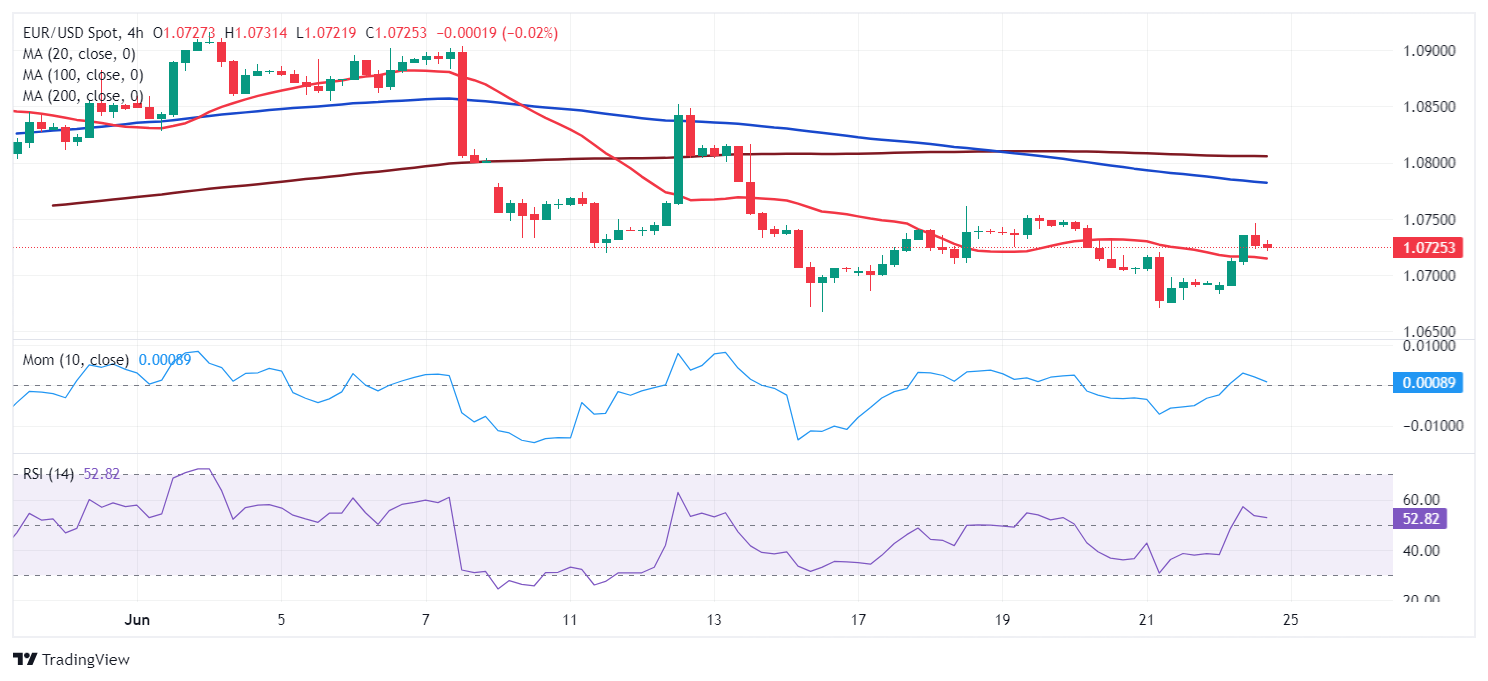
In the near term, and according to the 4-hour chart, the risk increasingly turns to the downside. EUR/USD develops above its 20 SMA, which anyway maintains a bearish slope. The 100 and 200 SMAs also head south while above the current level. Finally, technical indicators lost their upward strength after testing their midlines and slowly turn south, in line with another leg lower.
Support levels: 1.0710 1.0665 1.0620
Resistance levels: 1.0760 1.0810 1.0840