Products You May Like
- Shiba Inu price registered a 354% gain between February 27 and March 4 after breaking out of its 652-day consolidation.
- SHIB has already shed 42% and is currently trading at $0.0000264.
- Investors can expect the meme coin to drop another 32% and retest $0.0000178.
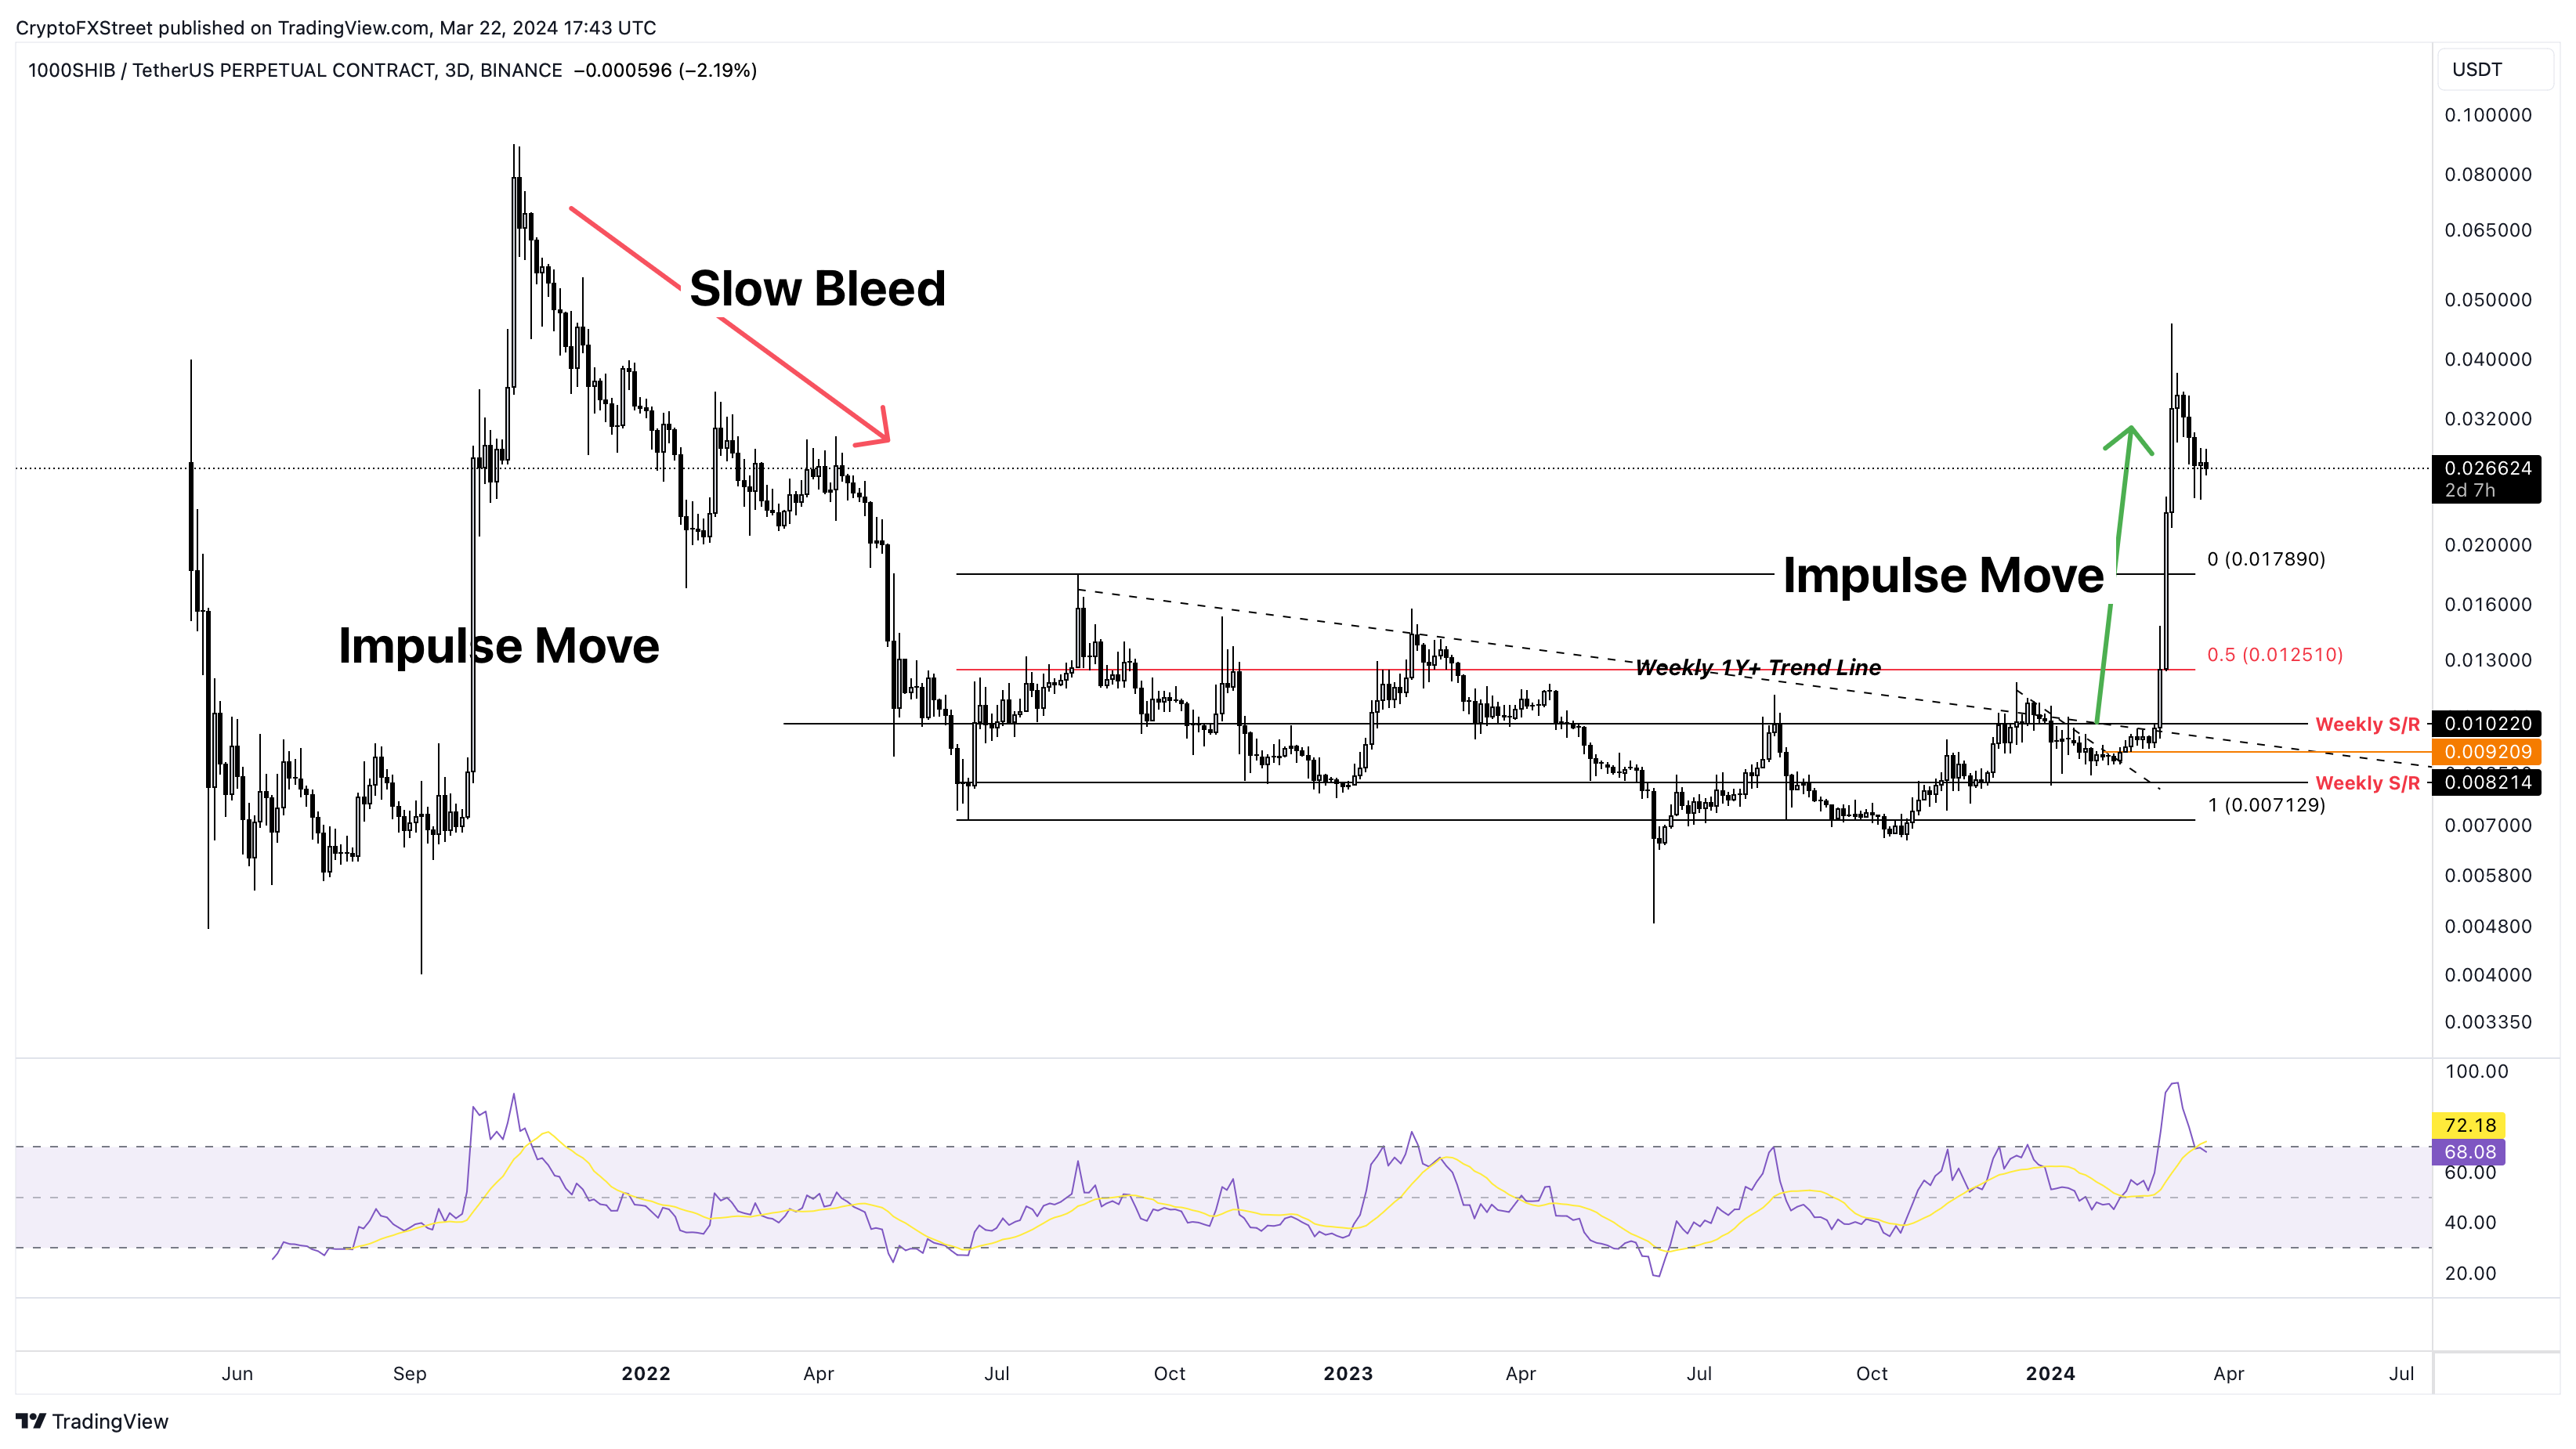
Shiba Inu (SHIB) price consolidation from May 13, 2022, ended on February 27, 2024, when SHIB saw a massive breakout rally. However, as investors continue to book profits, a slow bleed seems likely for the meme coin.
Also read: Shiba Inu holders take profits, pushing SHIB price nearly 45% below its 2024 peak
Shiba Inu price ready to slide lower
Shiba Inu price surged 354% between Feburary 27 and March 4, ending its two-year consolidation. While this move might seem impressive to new investors, meme coins, especially Dogecoin (DOGe) and SHIB, tend to do this more often.
The Shiba Inu price action noted a four-month consolidation in 2021, which ended in October 2021, as SHIB rallied 1,162%. What’s interesting is not the impulsive move but the price action that ensued—a slow bleed, where SHIB undid all the gains in the next eight months.
If history repeats, a similar price action could unfold for Shiba Inu price after the 354% rally. Therefore, investors should note that SHIB could drop at least 30% and retest the range high of $0.0000178.
It wouldn’t be surprising if Shiba Inu price flips the aforementioned level and tags the range’s midpoint at $0.0000125. This correction, however, would constitute a 52% decline.
Read more: Shiba Inu Price Prediction: SHIB might drop 10% for a liquidity sweep before next leg up
SHIB/USDT 3-day chart
On the contrary, Shiba Inu price could bounce off the range high at $0.0000178 and kickstart another leg up. This move would align with the broader market sentiment, which is bullish and invalidate the deeper correction outlook noted above.

