Products You May Like
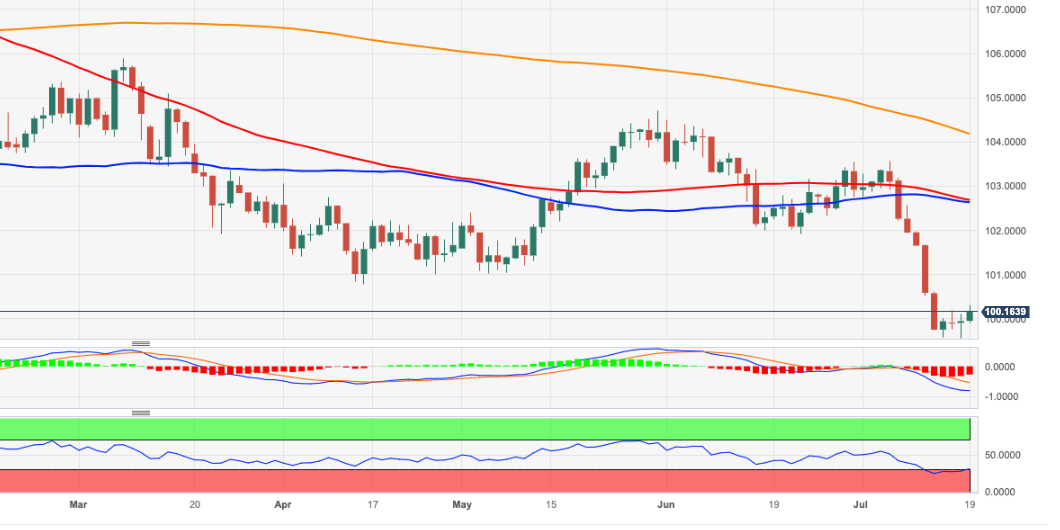
- DXY regains the area above the key 100.00 hurdle on Wednesday.
- Next on the upside comes the resistance band at 102.60/70.
DXY adds to Tuesday’s gains and surpasses the crucial 100.00 barrier on Wednesday.
A more serious bullish attempt in the index should clear the 102.60/70 band, where the provisional 55-day and 100-day SMAs converge.
If sellers regain the upper hand, the breach of the current 2023 low at 99.57 (July 14) could spark a deeper retracement to the weekly low of 97.68 (March 30 2022).
Looking at the broader picture, while below the 200-day SMA at 104.17, the outlook for the index is expected to remain negative.
DXY daily chart
This article was originally published by Fxstreet.com. Read the original article here.

