Products You May Like
- USD/ZAR bulls eye a bullish continuation on the break of consolidation.
- USD/ZAR bears eye a move into the bullish rally.
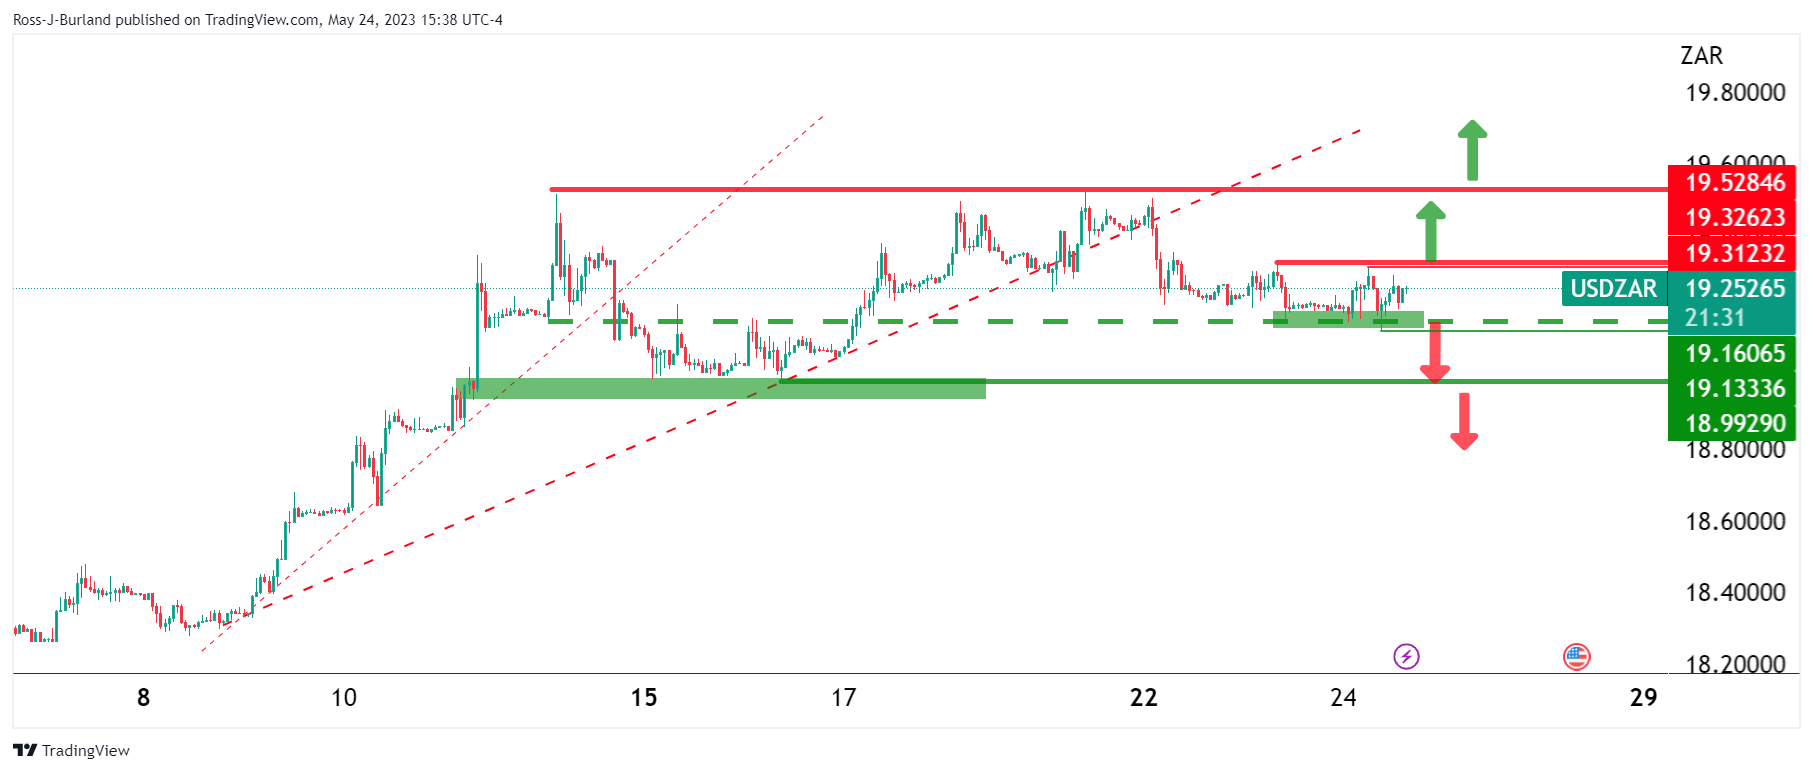
USD/ZAR is trading between 19.3123 and 19.1606 in the near term and within a sideways market range of 18.9929 and 19.5285. However, there is a bearish bias while below 19.3123 that will increase on a break of the various supports as illustrated on the following chart:
USD/ZAR H1 chart
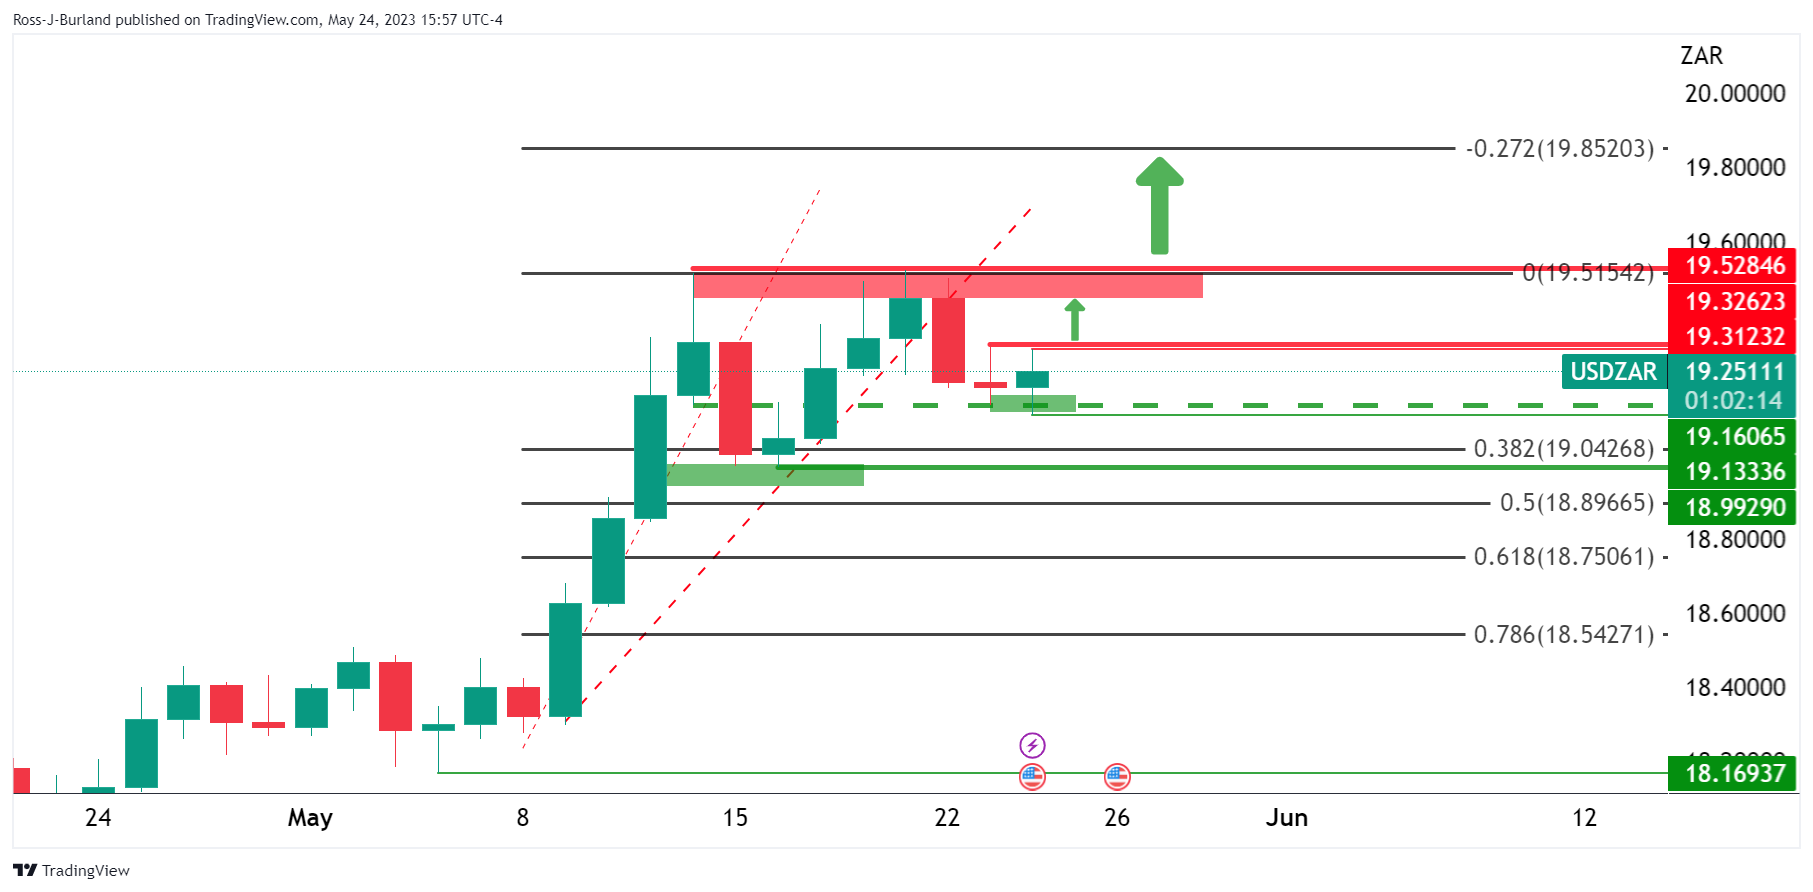
USD/ZAR has been rising from the lows of May near 18.1693 but should ZAR harden, the longs will be put under heat in a long squeeze.
USD/ZAR daily chart
On the other hand, we could easily see a bullish continuation with the bullish bias intact on a break of 19.3262 and 19.5285:
This article was originally published by Fxstreet.com. Read the original article here.