
Products You May Like
A technical signpost to watch for
There are a lot of
candlestick patterns. Some are more distinctive, some are less. It’s easy to be
on the lookout for pin bars – candlesticks with long upper or lower wicks that
indicate a reversal.
However, such
candlesticks, though quite common, do not appear all the time. Plus, there are
other patterns worth paying attention to, for example, ‘inside bars’.
Monitoring inside bars is much less intuitive.
Yet, inside bars
can be no less helpful and provide traders with trade ideas that have a big
probability of success. In this article, we have gathered some useful tips
about inside bars.
What is an inside bar?
As you can deduct
from the name of this pattern, an inside bar is a 2-candlestick pattern, in
which the second candlestick is completely engulfed by the first one. The first
candlestick is called ‘mother bar’, while the second one bears the name of the
pattern itself.
The color of the
inside bar is not important. The difference between an inside bar and harami is
that with an inside bar, the highs and lows are considered while the real body
is ignored.
An inside bar
forms after a large move in the market and represents a period of
consolidation. It indicates that the market is seized by indecision: neither
bulls nor bears can swing the price in their favor.
The idea is that
after consolidation the price tends to make a strong directional move. As a
result, if a trader spots a moment of calm (i.e. an inside bar), he/she will be
able to trade on the breakout of the consolidation range.
If an inside bar
formed within a strong trend, the odds are that the breakout will occur in the
direction of this trend.
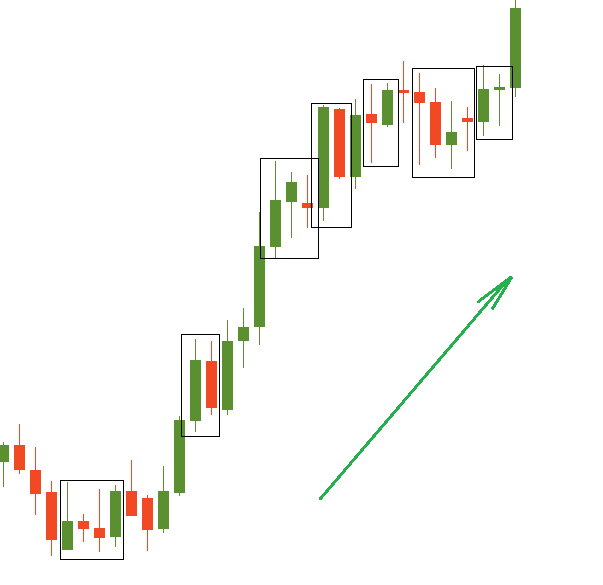
A string of inside bars during an uptrend
All in all, the
smaller the inside bar relative to the mother bar, the greater the possibility
of a profitable trade setup. Plus, the best case is when an inside bar forms
within the upper or lower half of the mother bar.
All of this shows
that the preceding trend is still strong and hence likely to continue, so an
entry in its direction will pay off nicely. Stop loss orders are usually placed
at the opposite end of the mother bar or around its middle if the mother bar is
bigger than average.
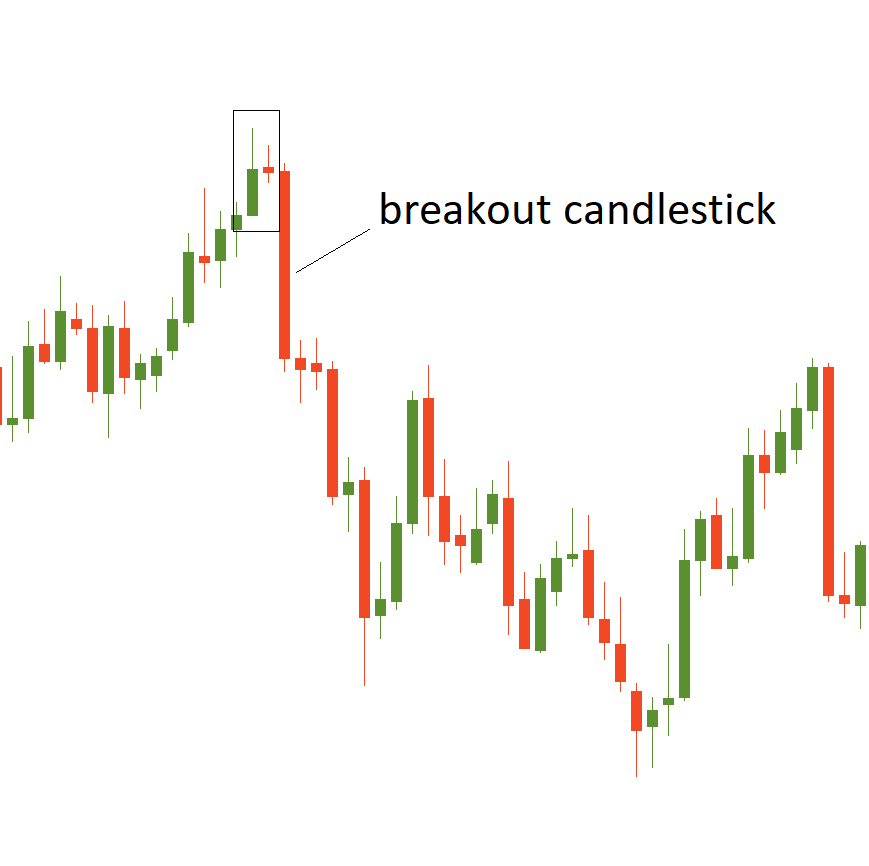
An inside bar followed by a strong breakout. Check the
place where the inside bar formed: is there a strong resistance? This may
explain why the price reversed down
Another tip: keep
track of inside bars on the daily chart and bigger timeframes. Lower timeframes
contain huge amounts of “noise” and thus may give false signals.
In addition, there
may be several inside bars within the mother bar (i.e. 2, 3 or even 4). This
simply means that consolidation will take longer, and the odds are that a
resulting breakout will be stronger.
Inside bar and fakey
So, trading inside
bars is all about breakouts. However, it’s common knowledge that breakout may
turn out to be false. A “fakey” pattern represents a false breakout of an
inside bar.
In other words,
it’s when the price breaks out an inside bar but is unable to continue moving
in that direction and quickly gets back. A fakey is a strong reversal signal.
Fakey may consist
of one candlestick (in this case it will be a pin bar) or two candlesticks (the
second candlestick will erase the progress of the first one). The most
important characteristic is that a false break of the pin bar should be obvious
and clearly visible at the chart.
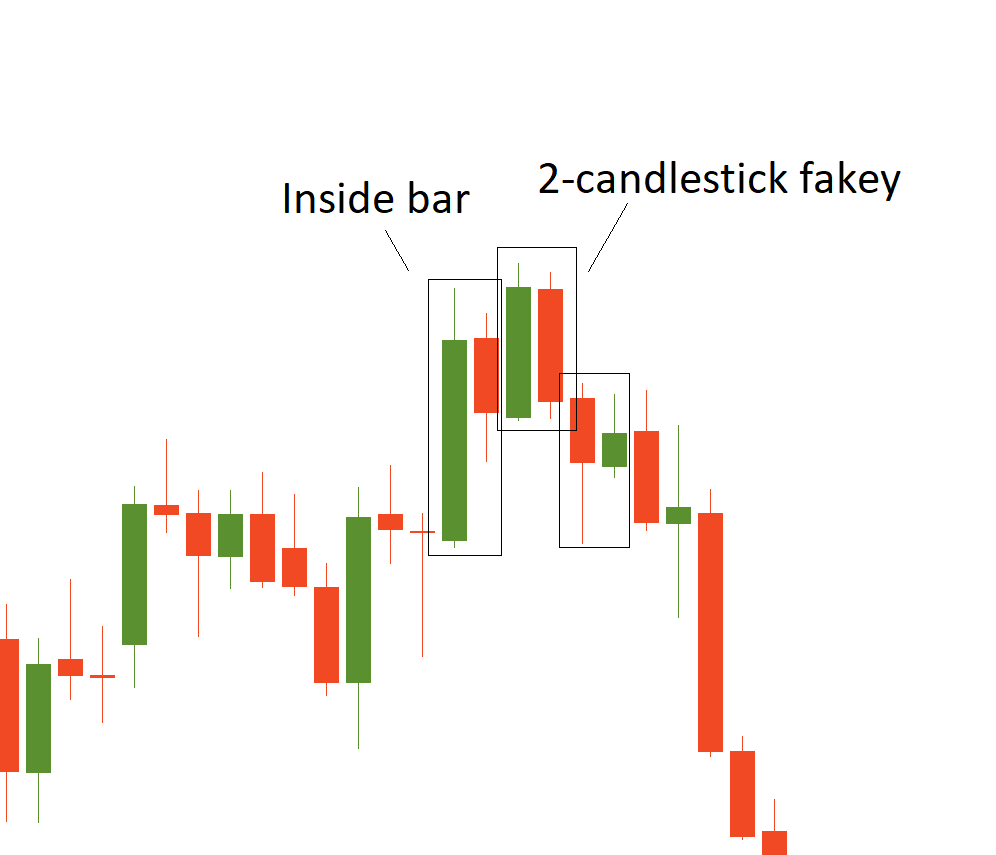
An example of a 2-candlestick fakey
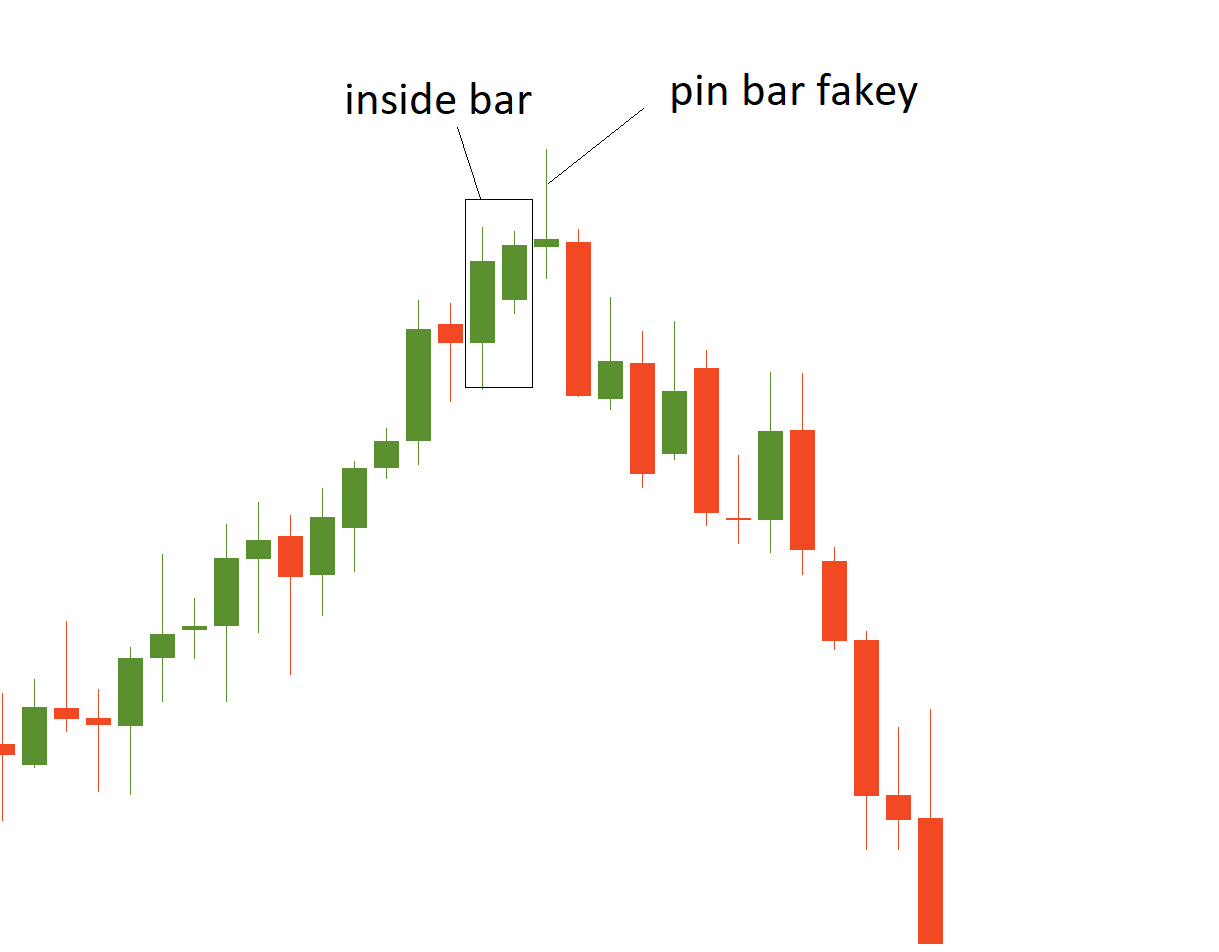
An example of a pin bar fakey
It’s wise to pick
up a trade signal provided by a fakey if it forms near an important
support/resistance level.
Conclusion
A thing to like
about inside bar trading strategy is that it revolves entirely around the price
action. Inside bar is not the most popular type of pattern but it can enhance
your understanding of the market several-fold.
Don’t forget to
monitor trends and support/resistance levels to distinguish the continuation
inside bars from potential reversal ones/fakeys. Finally, once a fakey is
identified, it’s a great hint of a new price swing and may be used as an entry
cue as well.
This article was submitted by FBS.