
Products You May Like
A look into the more familiar patterns on the chart
This article was submitted by ICM.com.
Technical
analysis is a type of analysis which is applied by traders on different
financial assets, where they study the past price performance of a certain
financial asset to forecast the future price direction or trend of this asset.
There are numerous ways of analyzing the markets via technical
analysis. Some traders might use technical indicators and oscillators, while
others prefer to use the price action itself.
According to the Dow Theory, the market discounts everything. In
other words, the price of a certain financial asset discount all the past,
current, and even future economic releases, events, etc.
So by studying the price action of a certain financial product,
traders will be searching for repeated price patterns which could assist them
in determining the future direction of the market.
In
this article, we will cover the classical chart patterns which are to split
into two categories: trend continuation patterns and trend reversal patterns.
Continuation Patterns
They are considered as a pause in the prevailing trend which implies
that during an uptrend, the bulls are preparing for another push higher whereas
during a downtrend, the bears are preparing for another push lower.
These patterns should be drawn properly by traders and they should
be very patient while trading the breakout of such patterns to avoid being
trapped in false breakouts. Usually, when these patterns take more time to
form, they will be followed by significant price movements.
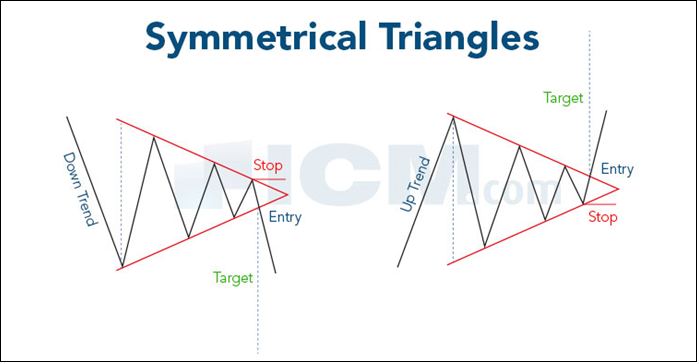
Triangles fall under the category of continuation patterns and are
of three types: symmetrical, ascending, and descending.
A
symmetrical triangle is formed of higher lows and lower highs which usually
signals that the market is balanced and ready to move either way. As the triangle
is being formed, the volume shrinks, and the breakout would be accompanied with
great volume which leads the market to the next move.
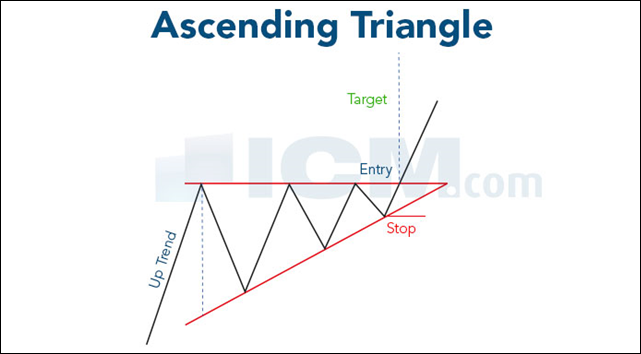
An ascending triangle is usually considered as a bullish pattern
which forms in an existing uptrend. It consists of a horizontal line combining
the highs or resistance points, and a line combining a series of higher lows.
Despite
the fact that the breakout could occur to either direction, traders usually
await a break to the upside as the triangle is a continuation pattern which
means that the market had a slight consolidation to prepare for an upcoming
price move within the same direction of the prevailing trend.
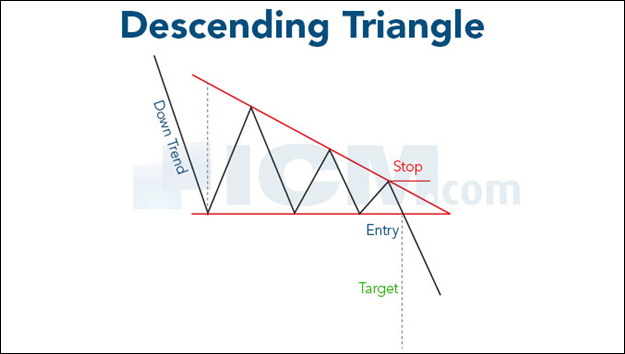
A descending triangle is considered as a bearish
structure which forms in an existing downtrend. It consists of a horizontal
line combining the lows or support level and a line combining a series of lower
highs. Traders will be waiting for a break to the downside as they believe that
the market took a pause from the prevailing trend and the trend will resume
when we breakout from this consolidation pattern.
Reversal Patterns
Reversal patterns are patterns that occur at the end of a prevailing
trend to give a signal to the trader that there could be a possibility of a
change in direction. In other words, these patterns will help us indicate that
the current price movement has topped or bottomed.
If a trader was holding buy positions in an uptrend, and he
detected the formation of a possible reversal pattern, then he should be
thinking of liquidating his position and re-assess his bias. Among the most
recognized classical reversal patterns are the head and shoulders formations,
the double top & bottom, and the triple top & bottom.
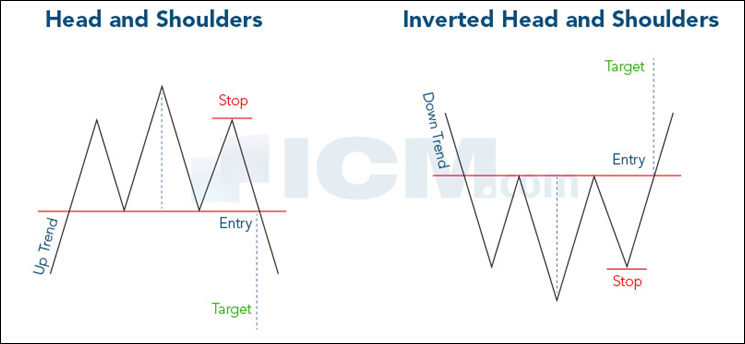
Head and Shoulders patterns consist of three peaks with the middle
peak being the highest, the left and right peaks holding similar or close price
levels. The volume will be the largest in the first shoulder and starts to
decrease until we break out from this formation.
A
Head and Shoulders pattern will appear at the top of an uptrend, while an
inverted head and shoulders pattern will form at the bottom of a downtrend.
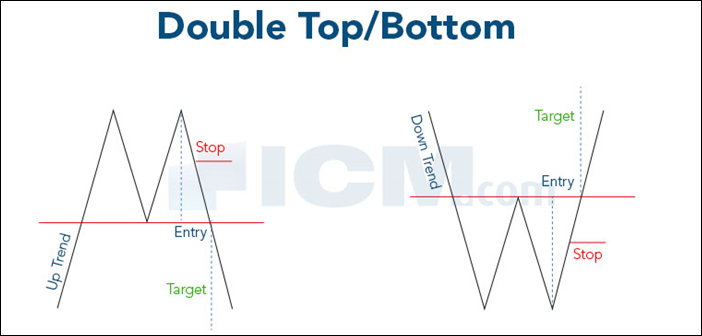
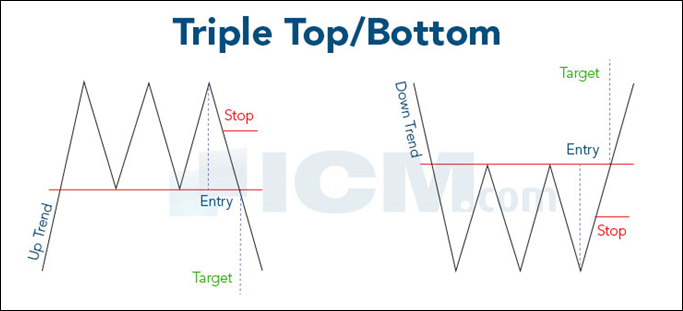
Double/Triple tops and bottoms are among the most reliable reversal
chart patterns and can be found easily on charts. Usually, they are formed when
the price of a financial asset retests a resistance or support zone without
being able to break above or below respectively.
Some
traders add technical oscillators such as the Relative Strength Index and
search for divergence to confirm their trading setup.
If we go over charts of different time frames or even range charts,
we will be able to find a classical chart pattern, whether from the mentioned
above or the rest. However, it is always better to adopt the formations that
occur on higher time frames taking into consideration the length, uniformity,
and clarity.
Traders should always be cautious about being stuck in a false
breakout. In order to avoid such entries, a trader should make sure that the
breakout is occurring with heavy volume, or ignore the initial breakout and
wait for a retest to the neckline/support/resistance and jump into a trade. Chart
patterns will help you pick your trades.
Many traders wait for such formations to trade which would lower
their number of trades and also reduce the percentage of losing trades.
Despite the theory that price discounts everything, it is better to
always apply fundamental analysis along with technical analysis. When a
technical trading setup matches the fundamental analysis findings, the trade
would have a higher chance of success.
Finally,
we advise all traders to stick to strict risk management techniques as risk
management is the key to successful trading.