Products You May Like
CRUDE OIL & GOLD TALKING POINTS:
- Crude oil prices sink alongside stocks, chart setup warns of topping
- Gold prices caught between conflicting cues, trend favors weakness
- Commodities may fall as hawkish Fed view survives US jobs report
Crude oil prices sank amid broad-based risk aversion, with the WTI benchmark tracking lower alongside the bellwether S&P 500 stock index. The selloff seems to reflect increasingly acute worries about the impact of Fed interest rate hikes.
Gold prices understandably struggled to find direction against this backdrop. On one hand, the risk-off mood offered support in that it weighed on bond yields, boosting the appeal of non-interest-bearing assets. On the other, the prospect of aggressive tightening fueled liquidation in the first place.
COMMODITIES MAY FALL AFTER US JOBS DATA
September’s US labor-market data is now firmly in the spotlight. Payrolls are expected to post a broadly on-trend 185k increase while the unemployment rate revisits the 18-year low of 3.8 percent set in May. Wage inflation is seen pulling back a bit to 2.8 percent from Augusts’ nine-year high of 2.9 percent.
On balance, anything short of improbably dismal disappointment is likely to keep the recent hawkish shift in the Fed policy outlook broadly intact. Indeed, data from Citigroup suggests US economic news flow has increasingly improved relative to forecasts in the past five weeks.
That might make the release more impactful in its passing rather than its substance. That means the US Dollar may resume its upward march alongside Treasury yields once event risk has been neutralized, an outcome that seems more likely than not to bode ill for commodities prices.
See our guide to learn about the long-term forces driving crude oil prices!
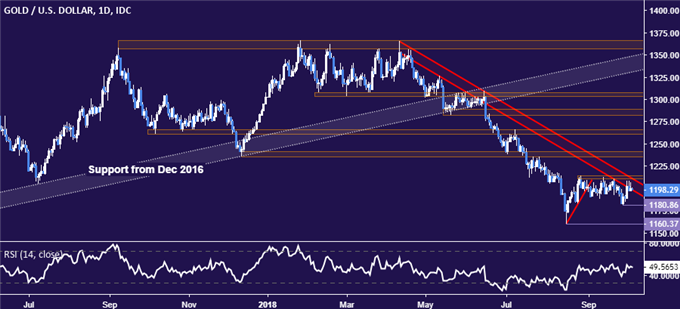
GOLD TECHNICAL ANALYSIS
Gold prices are stalling below resistance at 1214.30 (range top, trend line set from mid-April). From here, a break below the September 28 low at 1180.86 paves the way for a retest of the mid-August swing bottom at 1160.37. Alternatively, a daily close above resistance targets the 1235.24-41.64 zone.
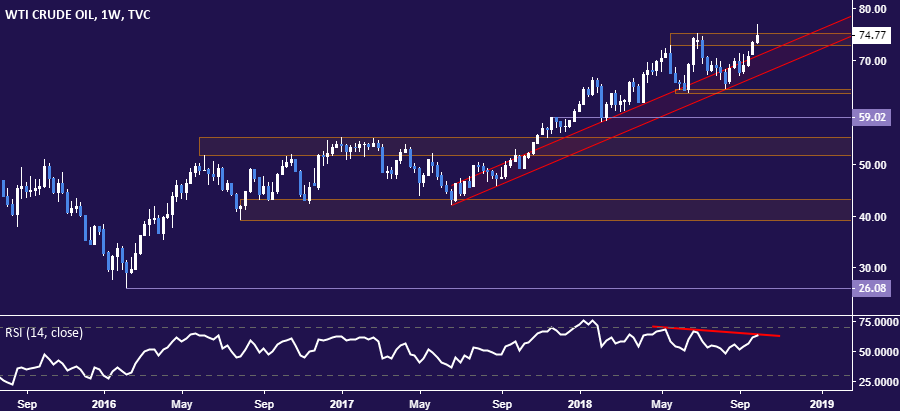
CRUDE OIL TECHNICAL ANALYSIS
Crude oil prices put in a Bearish Engulfing candlestick pattern on a test of resistance in the 75.00-77.31 area (August 2011 – June 2012 lows), hinting a move lower is ahead. From here, a daily close below the 72.73-88 zone opens the door for a test of the 70.05-26 region.

Turning to the weekly chart, a still more ominous picture emerges. The appearance of negative RSI divergence on a test of resistance in the 72.88-75.24 area may be signaling a longer-term top is in the works. Confirmation on a close below trend support – now at 67.18 – may open the door for prolonged weakness.
COMMODITY TRADING RESOURCES
— Written by Ilya Spivak, Currency Strategist for DailyFX.com
To contact Ilya, use the comments section below or @IlyaSpivak on Twitter