Products You May Like
No change expected
If the whippy action for the USD is repeated in New Zealand after the RBNZ rate decision, you might want to wait it out.
However that does not preclude traders from being aware of the levels that should lead to a more bullish or bearish bias. It will be up to the RBNZ (and Gov Orr) to give a more bullish or bearish push.
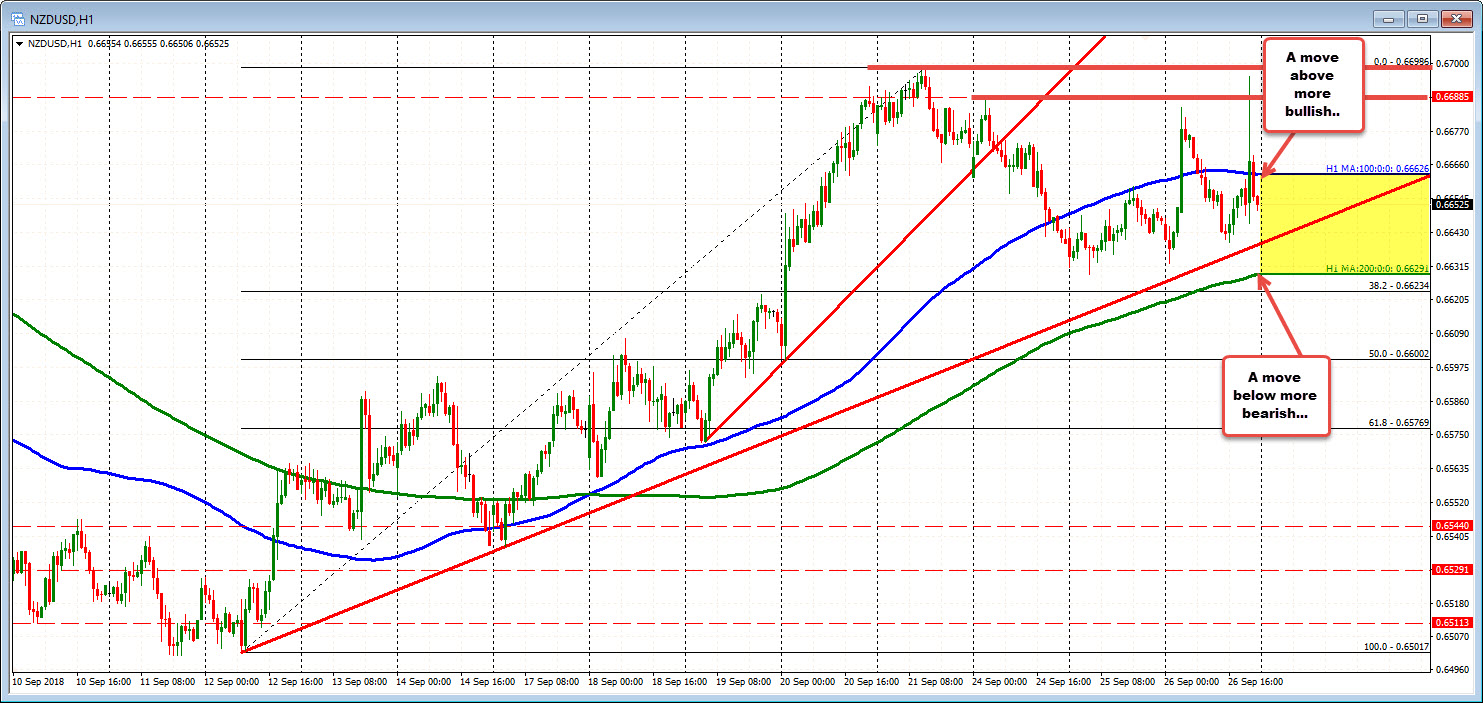
Technically, looking at the hourly chart, the ups and downs of from the USD reaction sent the price above its 100 hour MA at 0.66626. A move above (and staying above) would be more bullish, and would target the highs from last Friday and earlier in the week at 0.66986 (call it 0.6700), and 0.66885 respectively. On the downside, the level to eye would be the 200 hour MA at 0.6629.
The price is trading between those two MAs at 06656 currently.
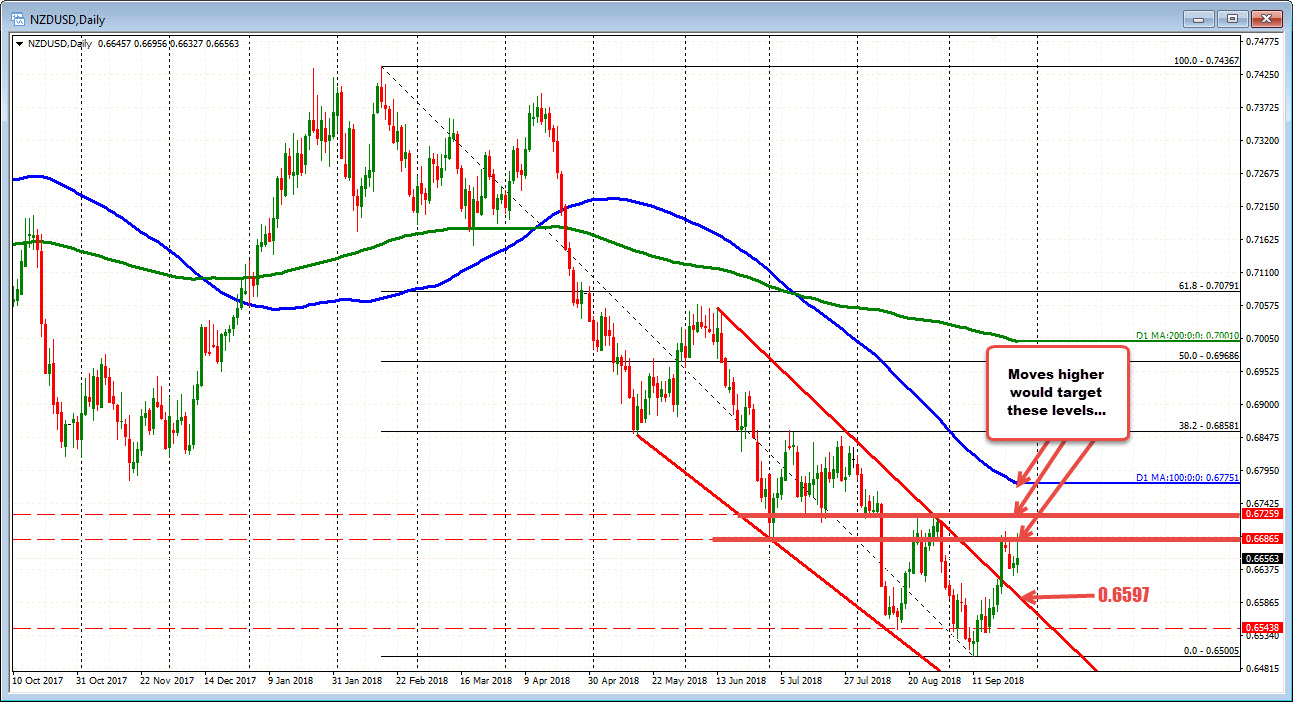
Taking a broader view of the daily chart, the price has been correcting to the upside since bottoming on September 12th. That run higher has taken the price above a topside trend line at 0.6597 currently. That will be a level to target on a more dovish outlook.
On the topside, the rally has stalled near the swing lows from early July (at 0.66865). That swing low from July increases the importance of getting above 0.66885 high from Monday at 0.66885 (and then the 0.6700) high from last week. A move above that level will target the key 100 day MA at 0.6775.