Products You May Like
GOLD & CRUDE OIL TALKING POINTS:
- Commodity prices stall as all eyes turn to FOMC policy announcement
- Gold prices may fall as anti-fiat appeal fizzles amid US Dollar rebound
- Crude oil prices vulnerable if EIA inventory data echoes API projection
Commodity prices marked time in Tuesday trade, with investors seemingly unwilling to commit to a directional bias before the much-anticipated FOMC monetary policy announcement crosses the wires. The standstill was broad-based, with the bellwether S&P 500 stock index marking time in familiar territory and the US Dollar little-changed against its major counterparts.
GOLD MAY FALL AS US DOLLAR GAINS AFTER FED MEETING
Fed Chair Jerome Powell and company are widely expected to issue an interest hike. Indeed, the priced-in probability of such an outcome implied in Fed Funds futures is 95 percent. The likelihood of a further increase in December is pegged at 78.6 percent. Absent a highly improbable dovish about-face from the rate-setting committee, that puts the spotlight on the 2019 policy path.
As it stands, markets have accounted for 50 basis points in tightening – meaning two rate hikes at the typical pace of 25bps apiece – for next year. The central bank’s own forecast has called for three of them, with one further hike slated for 2020. An upshift on this front is likely to boost the greenback, weighing on anti-fiat gold prices by extension.
Interestingly, US Dollar selling over the past month has played out alongside a drop in US Treasury bonds, pointing to the unwinding of haven demand as the driving narrative. Against this backdrop, even a status-quo Fed stance may send it higher, if only in that the announcement puts the spotlight back on the widening yield gap between USD and other currencies.
CRUDE OIL AT RISK ON FED, EIA INVENTORY DATA
That bodes ill for Dollar-denominated commodities at large, including crude oil. The EIA weekly inventory flow report is expected to show stockpiles shed 1.13 million barrels last week. A leading estimate published by API yesterday pointed to a 2.9 million barrel build however. Official figures echoing that outcome might compound any Fed-inspired selling pressure.
See our guide to learn about the long-term forces driving crude oil prices!
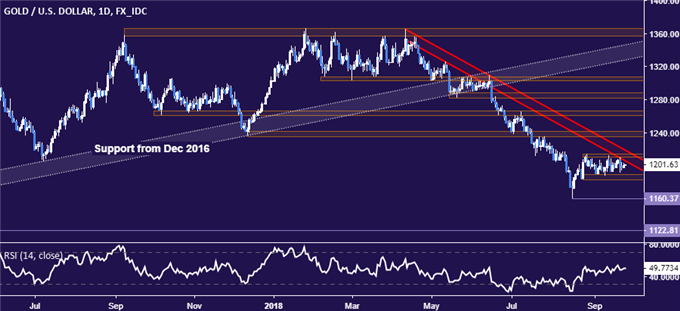
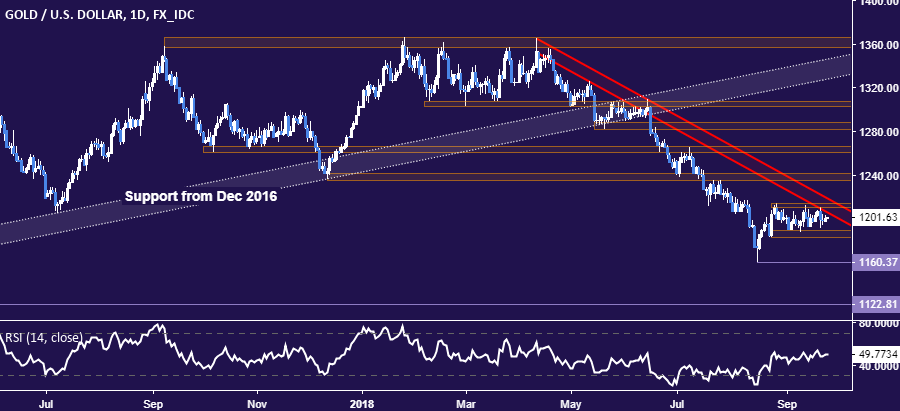
GOLD TECHNICAL ANALYSIS
Gold prices continue to stall below the August 28 high at 1214.30. From here, a break above that as well as trend resistance at 1219.00 confirmed on a daily closing basis exposes the 1235.24-41.64 area. Alternatively, a drop below the range floor marked by the August 24 lowat 1183.28 aims for the swing bottom at 1160.37.
CRUDE OIL TECHNICAL ANALYSIS
Crude oil prices paused to digest gains below chart inflection point at 72.88. A renewed upward push that leads to a daily close above this barrier exposes the 75.00-77.31 area next. Alternatively, a reversal back below the 70.15-41 zone targets rising trend support in the 65.91-67.74 region.

COMMODITY TRADING RESOURCES
— Written by Ilya Spivak, Currency Strategist for DailyFX.com
To contact Ilya, use the comments section below or @IlyaSpivak on Twitter