Products You May Like
• The pair stalled its recent upsurge to six-week tops and started retreating from an important confluence region, comprising of 100-day SMA and a short-term ascending trend-line on the 1-hourly chart.
• The corrective fall has now dragged the pair back towards another ascending trend-line support, which has been acting as an important support over the past two weeks or so.
• A combination of two converging ascending trend-lines constituted towards the formation of a bearish ‘Rising Wedge’ chart pattern, indicating that the recent bullish momentum might have already ended.
• A convincing break through the mentioned support, leading to a subsequent weakness below 100-hour SMA will reinforce the bearish formation and prompt some aggressive long-unwinding trade.
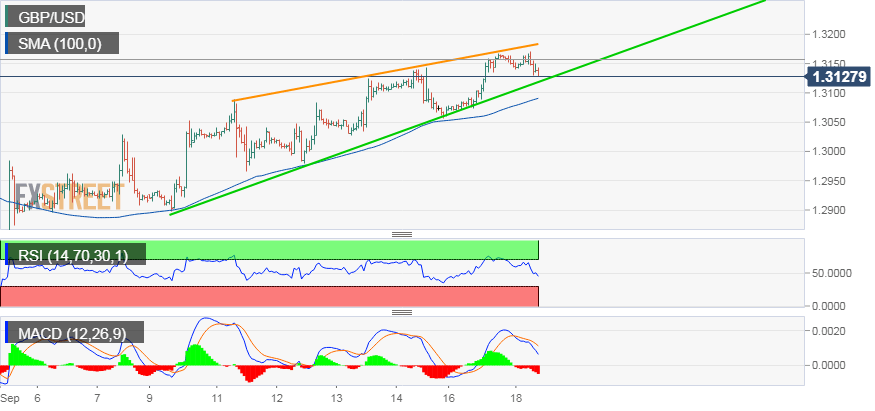
Spot Rate: 1.3128
Daily High: 1.3171
Trend: Turning bearish
Resistance
R1: 1.3176 (100-day SMA)
R2: 1.3200 (round figure mark)
R3: 1.3228 (R2 daily pivot-point)
Support
S1: 1.3110 (ascending trend-line support)
S2: 1.3090 (100-period SMA H1)
S3: 1.3035 (S2 daily pivot-point)