
Products You May Like
- Crude oil main bull trend is having a consolidation period.
- Crude oil is consolidating last week decline and is currently forming a triangle compression pattern (green lines).
- The RSI is at 47 and the MACD is turning south as both indicators are pointing to further losses. On a bear breakout, the initial target would be located near 66.87 (September 7 low).
Crude oil WTI 240-minute chart
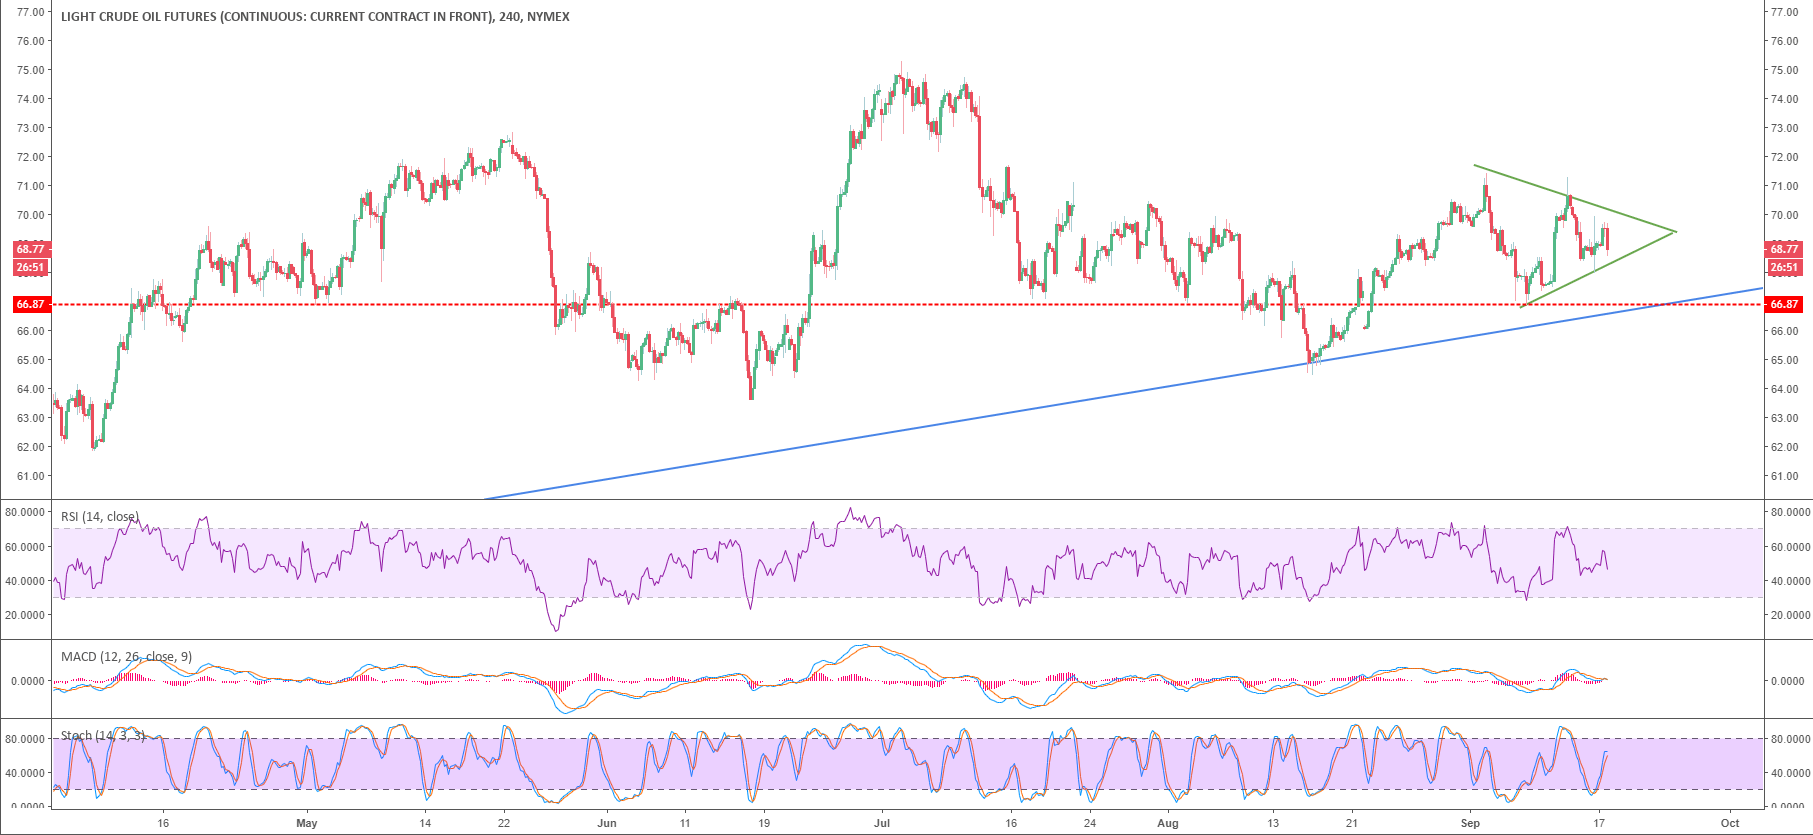
Spot rate: 68.81
Relative change: 0.00%
High: 69.69
Low: 68.51
Main Trend: Bullish
Short-term trend: Bearish
Resistance 1: 69.00 figure.
Resistance 2: 69.30 August 24 high
Resistance 3: 69.44 June 25 high
Resistance 4: 70.00 figure
Resistance 5: 70.53 May 24 low
Resistance 6: 71.41 September 4 high
Support 1: 68.00-68.30 zone, figure and supply/demand level
Support 2: 67.84 August 14 swing high
Support 3: 67.16 June 14 high
Support 4: 67.72 June 26 low
Support 5: 66.87 September 7 low
This article was originally published by Fxstreet.com. Read the original article here.