Technical Analysis

Chart in focus: AUD/JPY. Trade war and risk off tone

Products You May Like

Selling AUDJPY

On Friday last week I highlighted the risk to the markets if Trump announced further tariffs on Chinese exports: 

As, we already know by now if you are a regular FX follower, what’s bad for china is bad for the AUD. This is the largest impact for the AUD at the moment, as despited having some good data in the week (GDP, and Trade balance), all rallies have been sold. There are fears that households will feel the pressure of the growing debt, the raising of mortgage rates , slow inflation, and wages staying low all have led to AUD rallies being sold. If Trump gets a tweeting and calling down fire and tariffs on China, the AUD is going to feel the pain.     

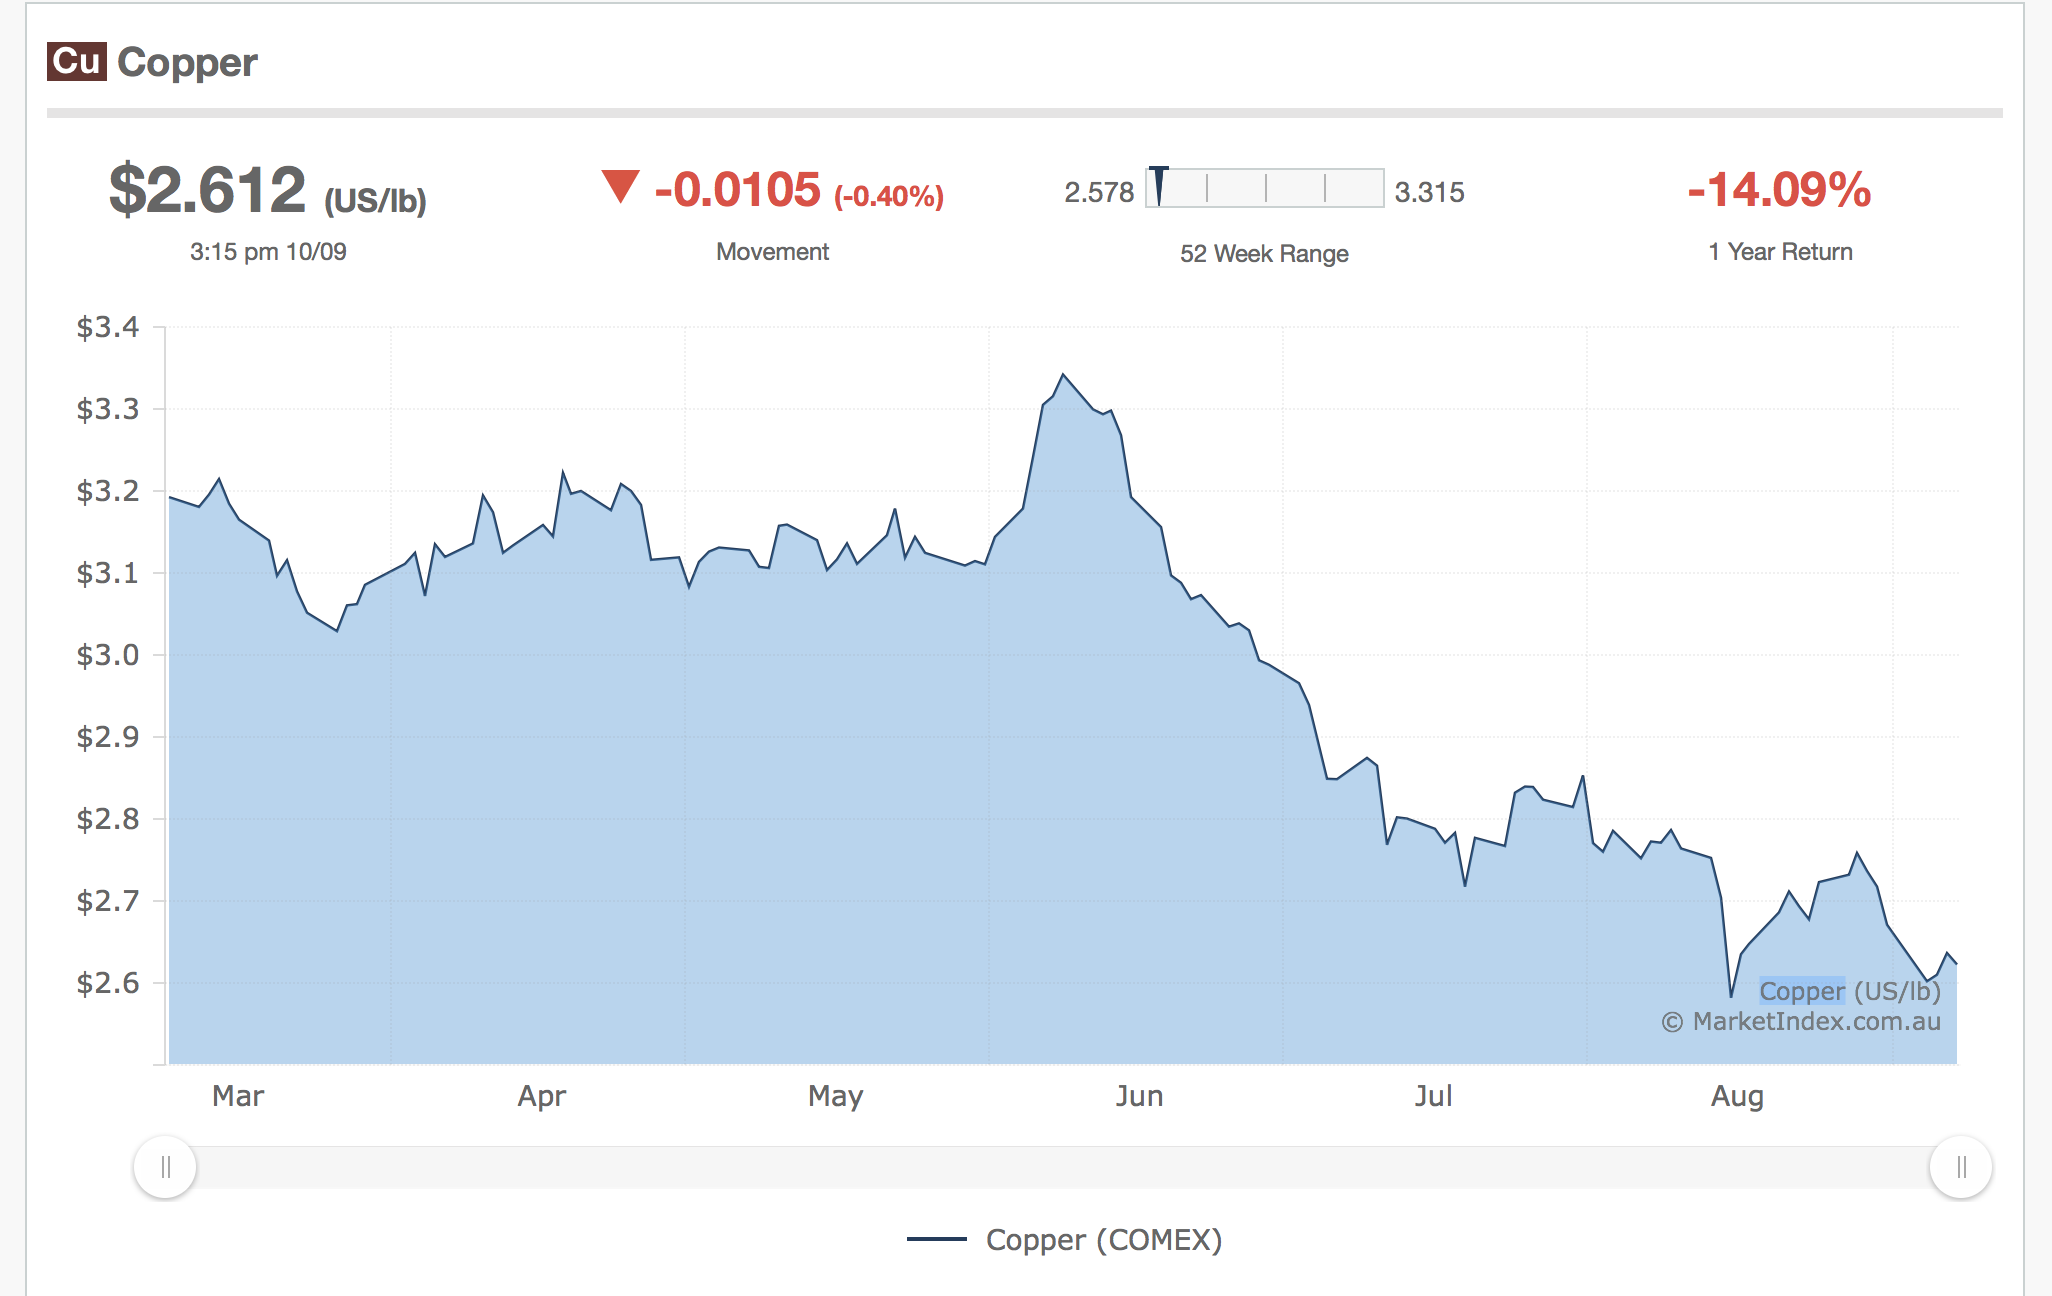
So, today we are at a crossroads as to where we go from here. Overnight the ranges have been subdued. The Nikkei is currently up 0.15%, so pretty flat out there at the moment. Taking a further look at AUD we see that prices of copper are continuing to fall.
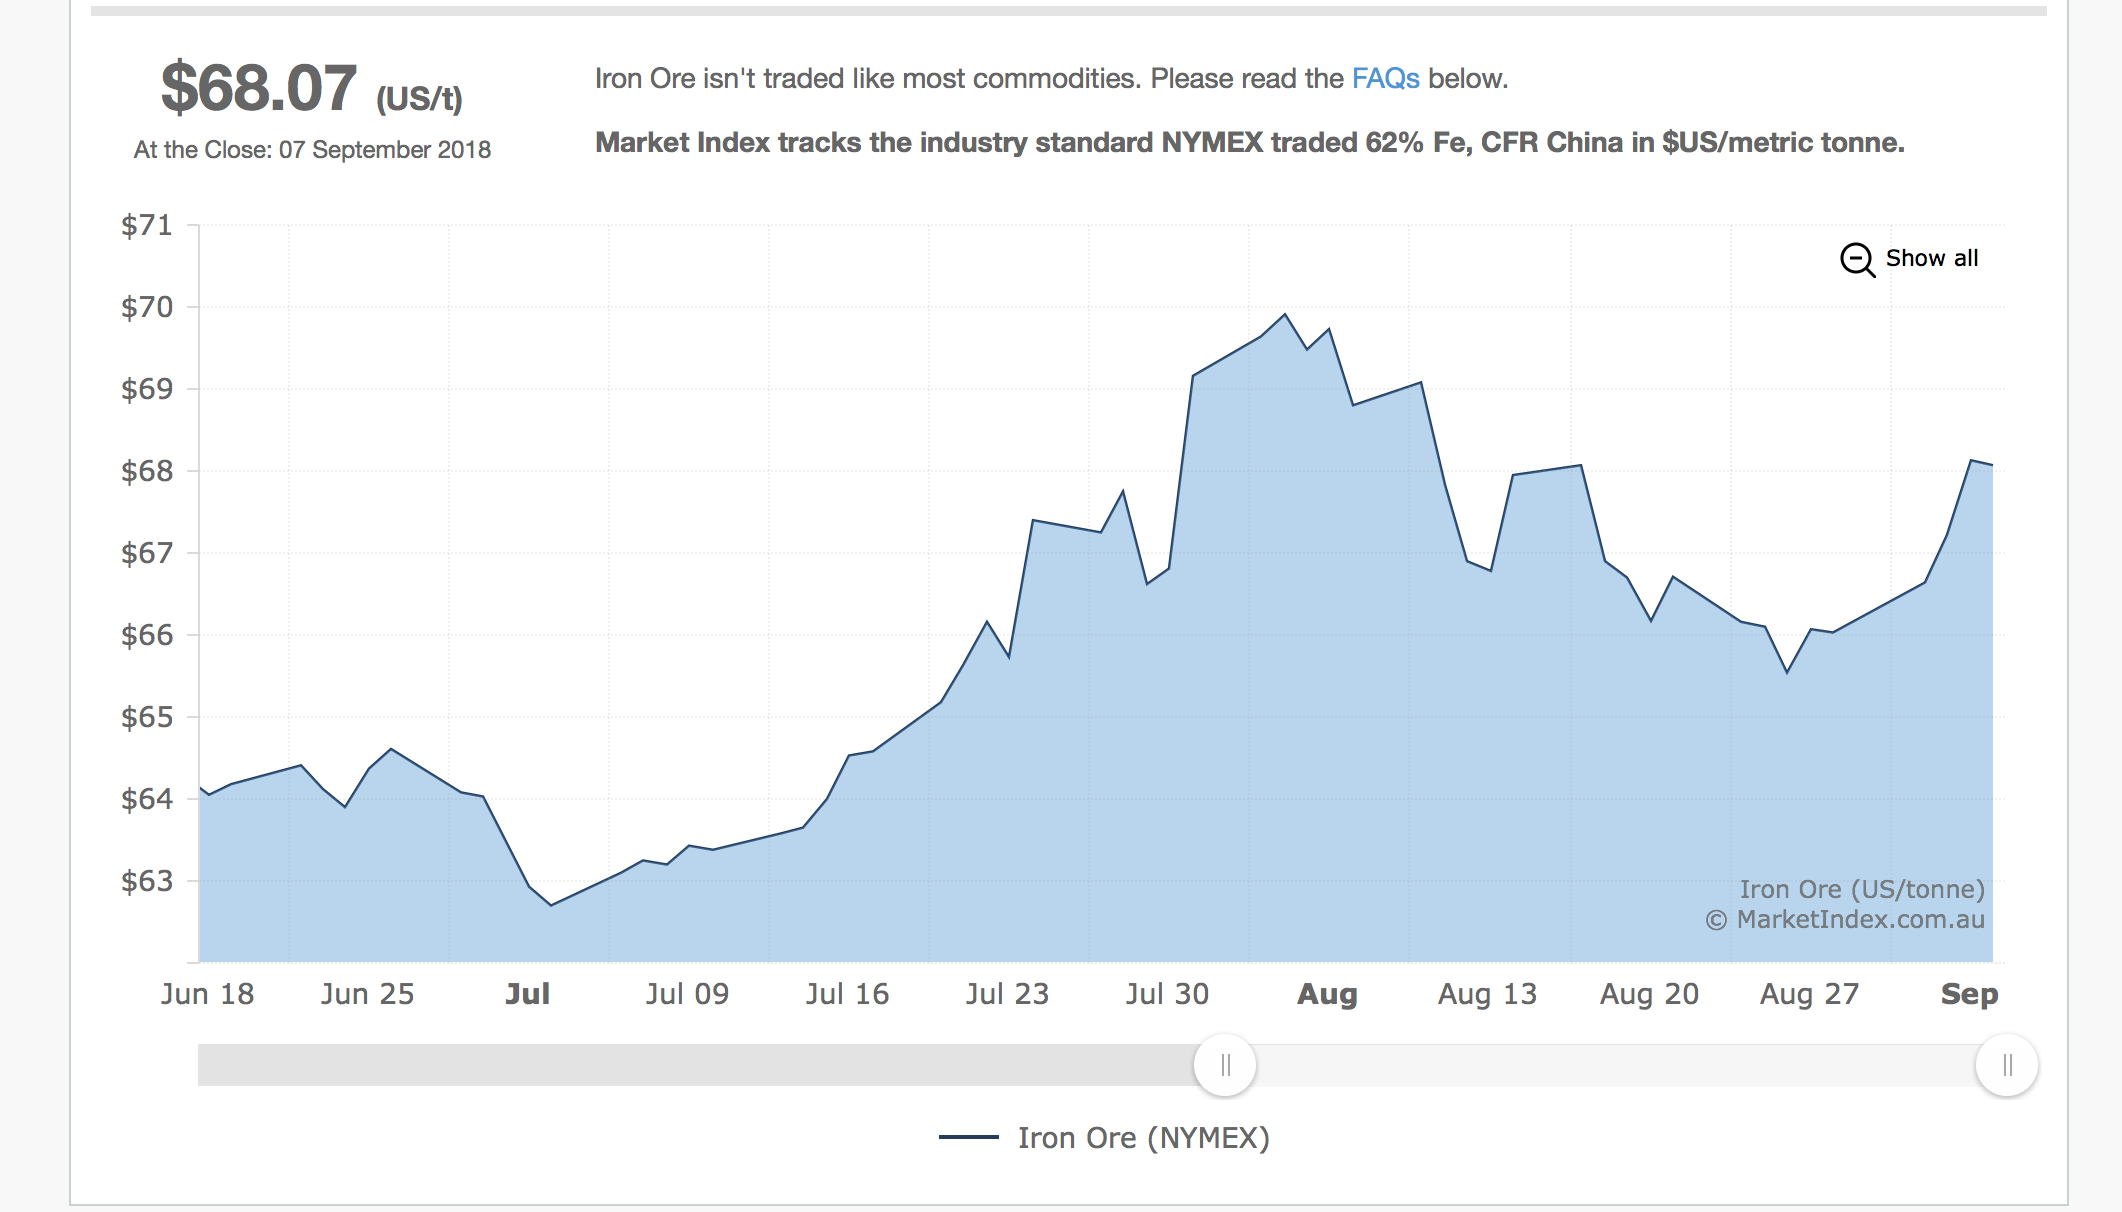
Iron ore has pulled away from it’s peak in August and has been dropping throughout August with price having made a move back towards the highs recently.
A few people at the end of last week in the comments sections seemed to be trying to catch an AUD bottom. I was pretty hectic on Friday, so I couldn’t make time to reply at the time without the risk of sounding too cocky or defensive of my own position. That didn’t make sense in a market that was waiting for a tariff announcement on China from the US. Why would you try to trade against that move? The most obvious trade is to go with the fundamental picture. So, for our education, a chart like the AUDJPY and AUDCAD are charts which are fundamentally good for trading pullbacks as we can reasonably expect the selling to continue. Of course, the fundamental picture can change, at anytime, so be aware of any changes. Finally, AUS business confidence is out tomorrow, and you can check out Eamonn’s sage comments on it here. 

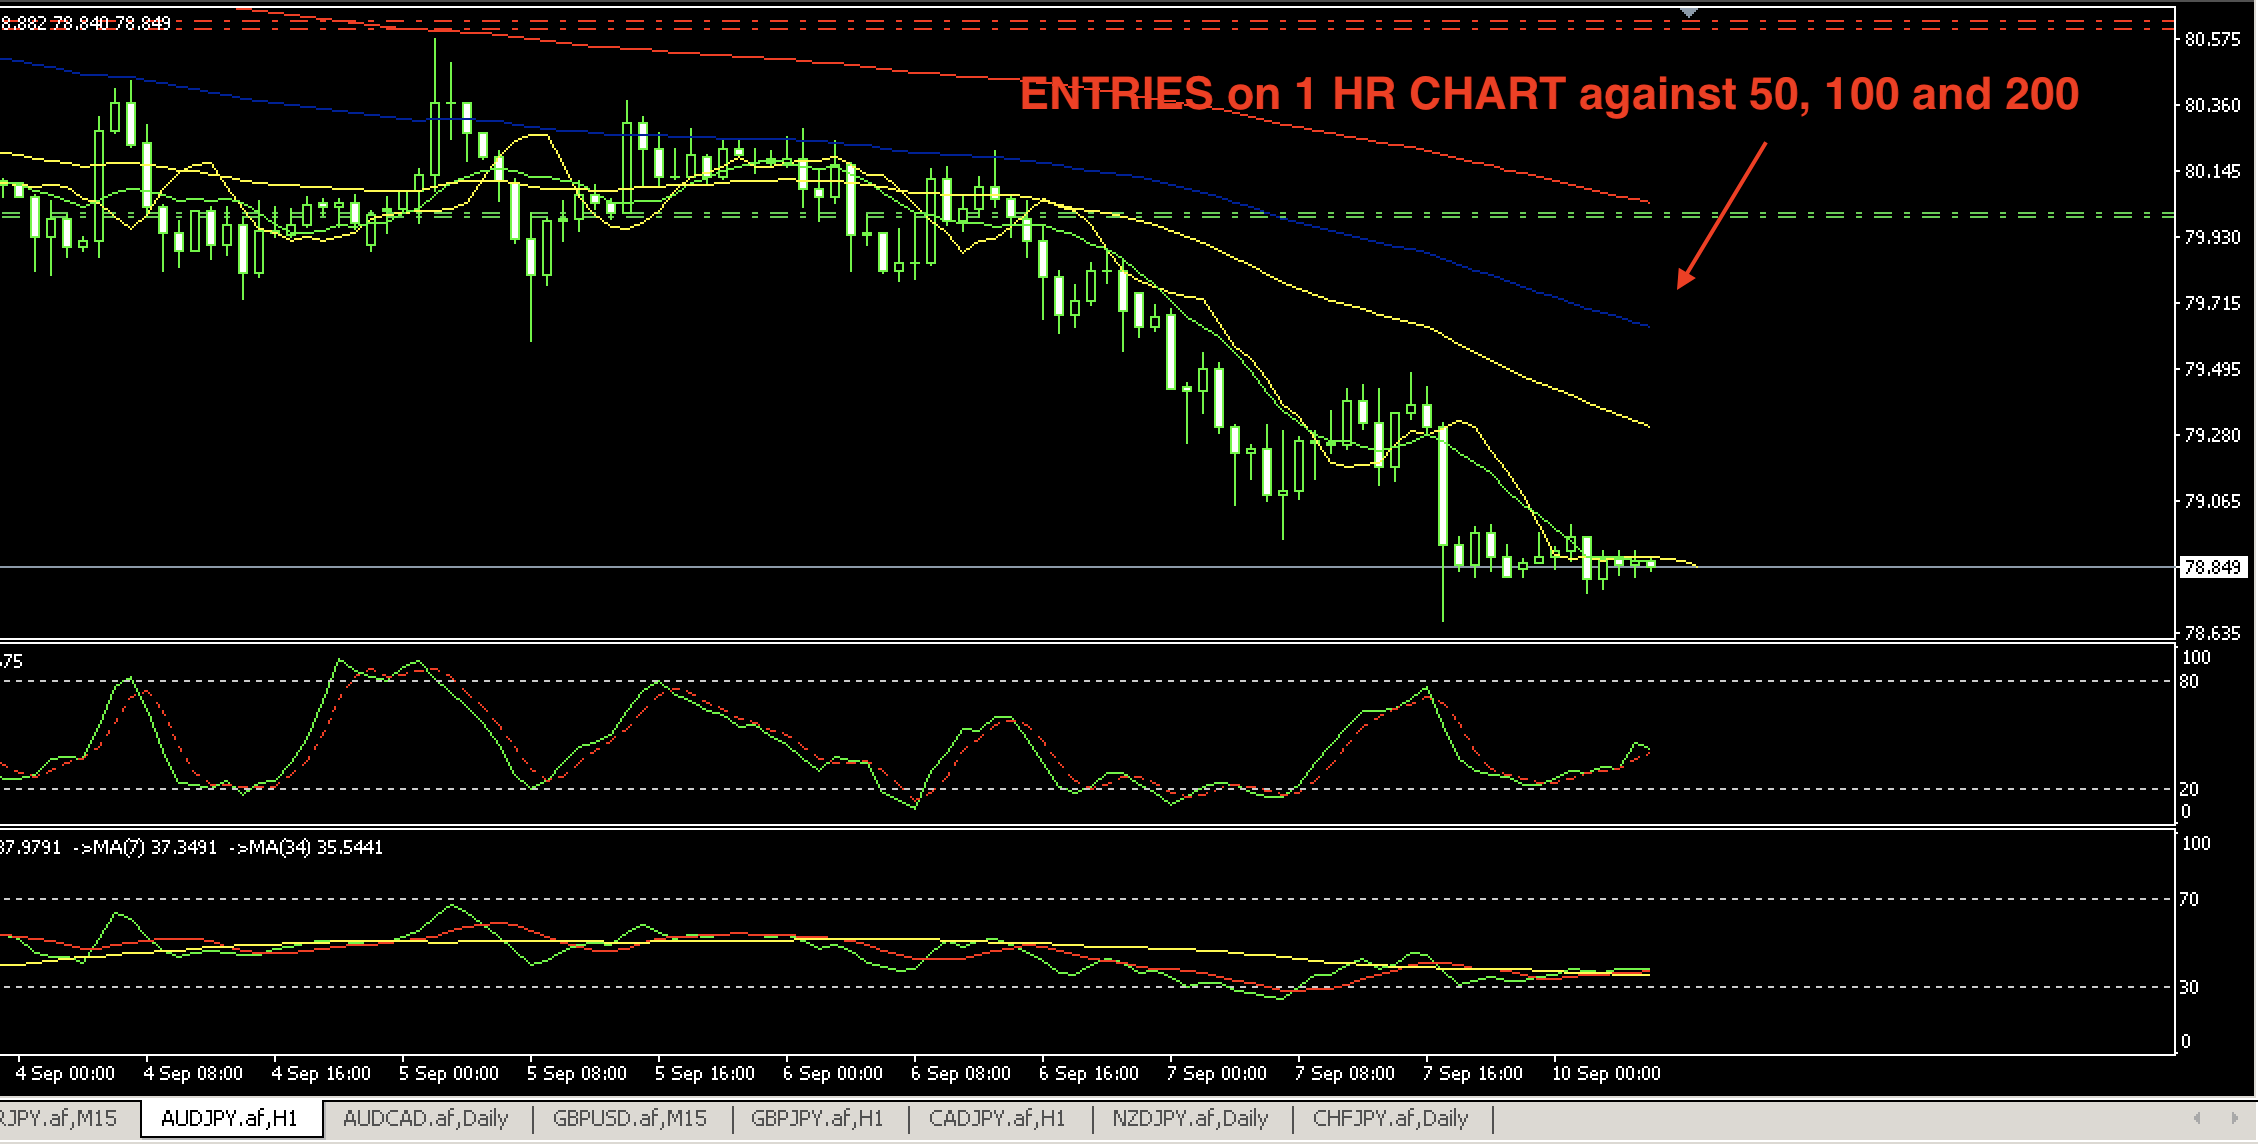
AUD/JPY 1 hr chart Chart below

Entries can be made on price retesting the 50, 100 and 200 MA. Check out if/how price reacts against those levels. Stops can then placed accordingly. The place to put your stops as the ‘I am definitely wrong on this trade‘ is going to be above the 200 MA. Tighter stops could be placed using the 100 MA if appropriate, but obviously you have more risk of being stopped out, so allow the market context to guide you where to place your stop. For more helpful guidance on stop placement make sure you check out Greg’s excellent video.

ForexLive

Products You May Like

Articles You May Like

NZDUSD pressing against downside support targets
EBC Financial Group Enhances Liquidity and Lowers Trading Costs on Major Stock Indices
What are the key items on the economic calendar this week?
NZDUSD moves back into swing area and between 100/200 day MAs going into the weekend.
AUDUSD trades in the middle of close support and close resistance levels

Leave a Reply

Your email address will not be published. Required fields are marked *