Products You May Like
All JPY pairs running
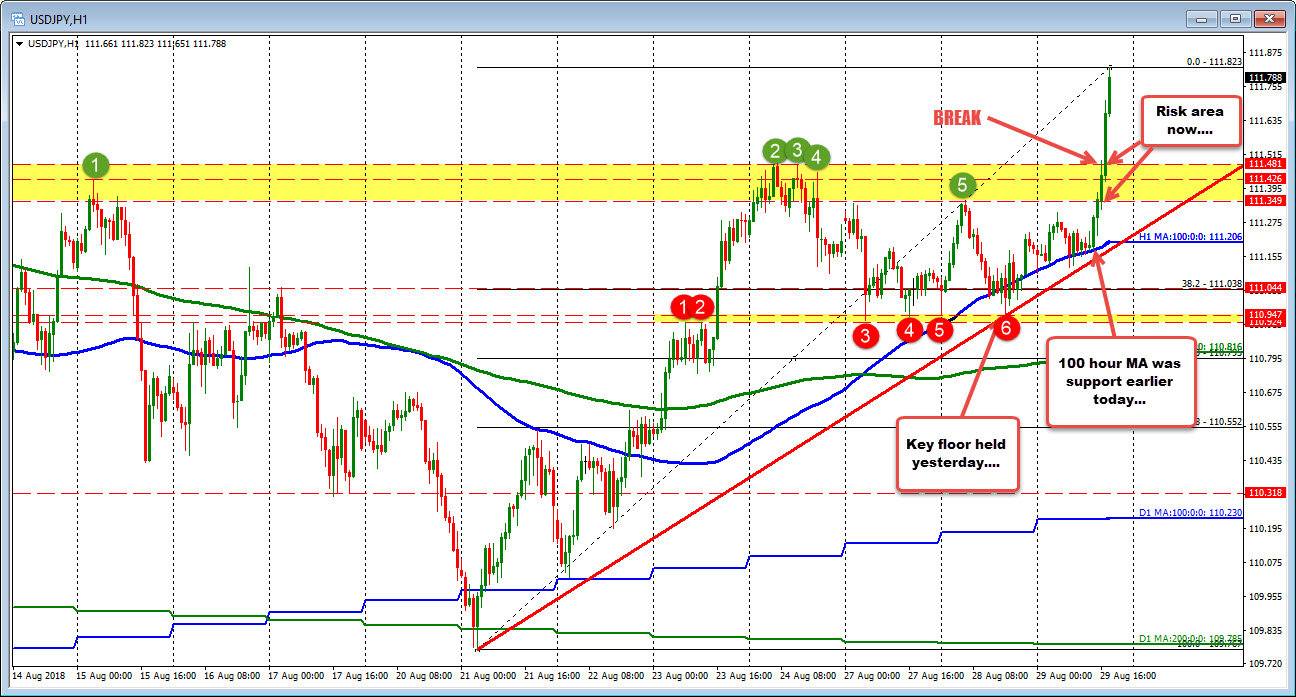
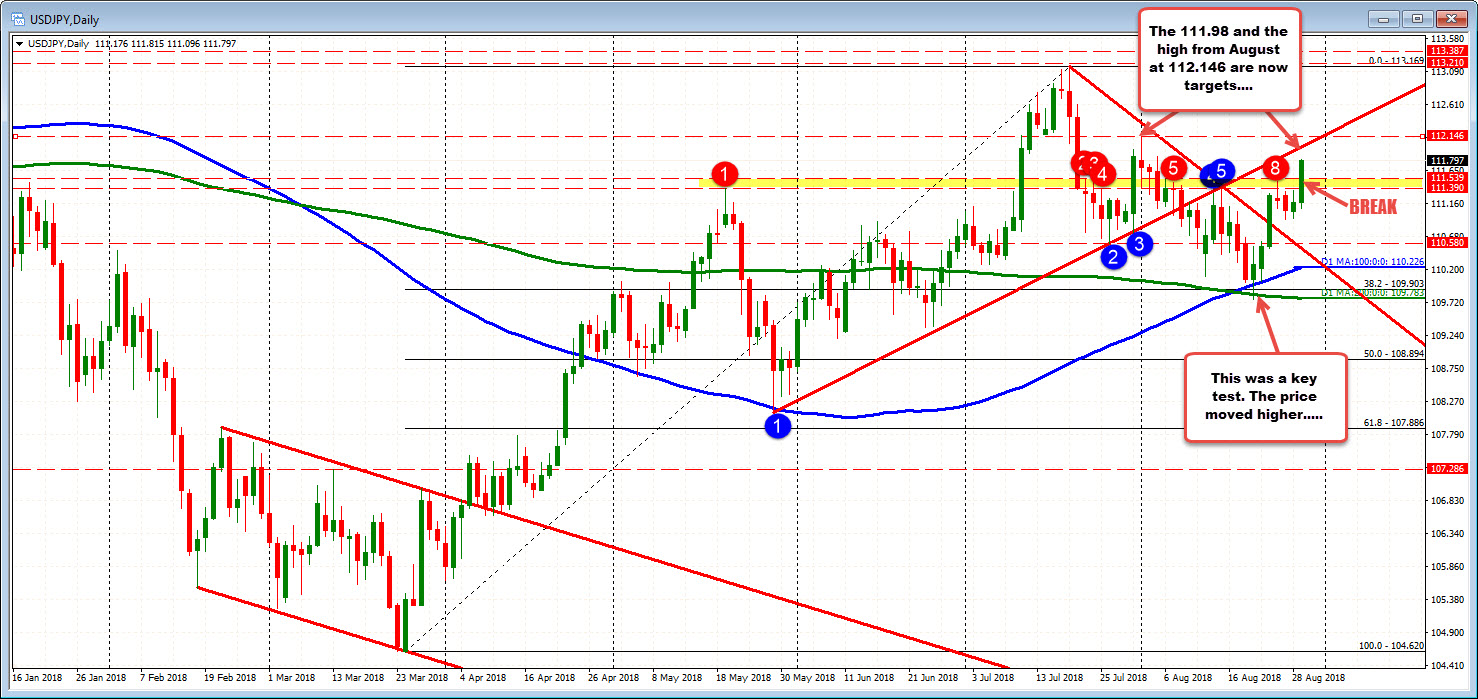
The USDJPY is racing higher with the pair moving above a swing area at 111.39-54 (see yellow area on the daily chart below).
Looking at the daily chart, the price is moving toward the underside of a trend line at 111.98. That line was support. It was later resistance (follow blue circles). Its a key level and buying may have a stall there on a test. Be aware.
Above that is the August high at 112.146 will be targeted. That high was on the first day of the month. Are we ultimately looking to finish the lap for August. Two more days in the month.
Drilling to the hourly chart, what is encouraging – for the bulls – is what happened at lows this week. On Monday and Tuesday a price floor was created at a ceiling from August 23rd (see red numbered circles). Holding was bullish.
Today, the 100 hour MA (blue line in chart below) and upward sloping trend line, stalled the falls. That too is bullish.
The race higher today was certainly helped by those technical clues. We got the break today.
So bulls are in charge but watch the 111.98 on more upside today.