Products You May Like
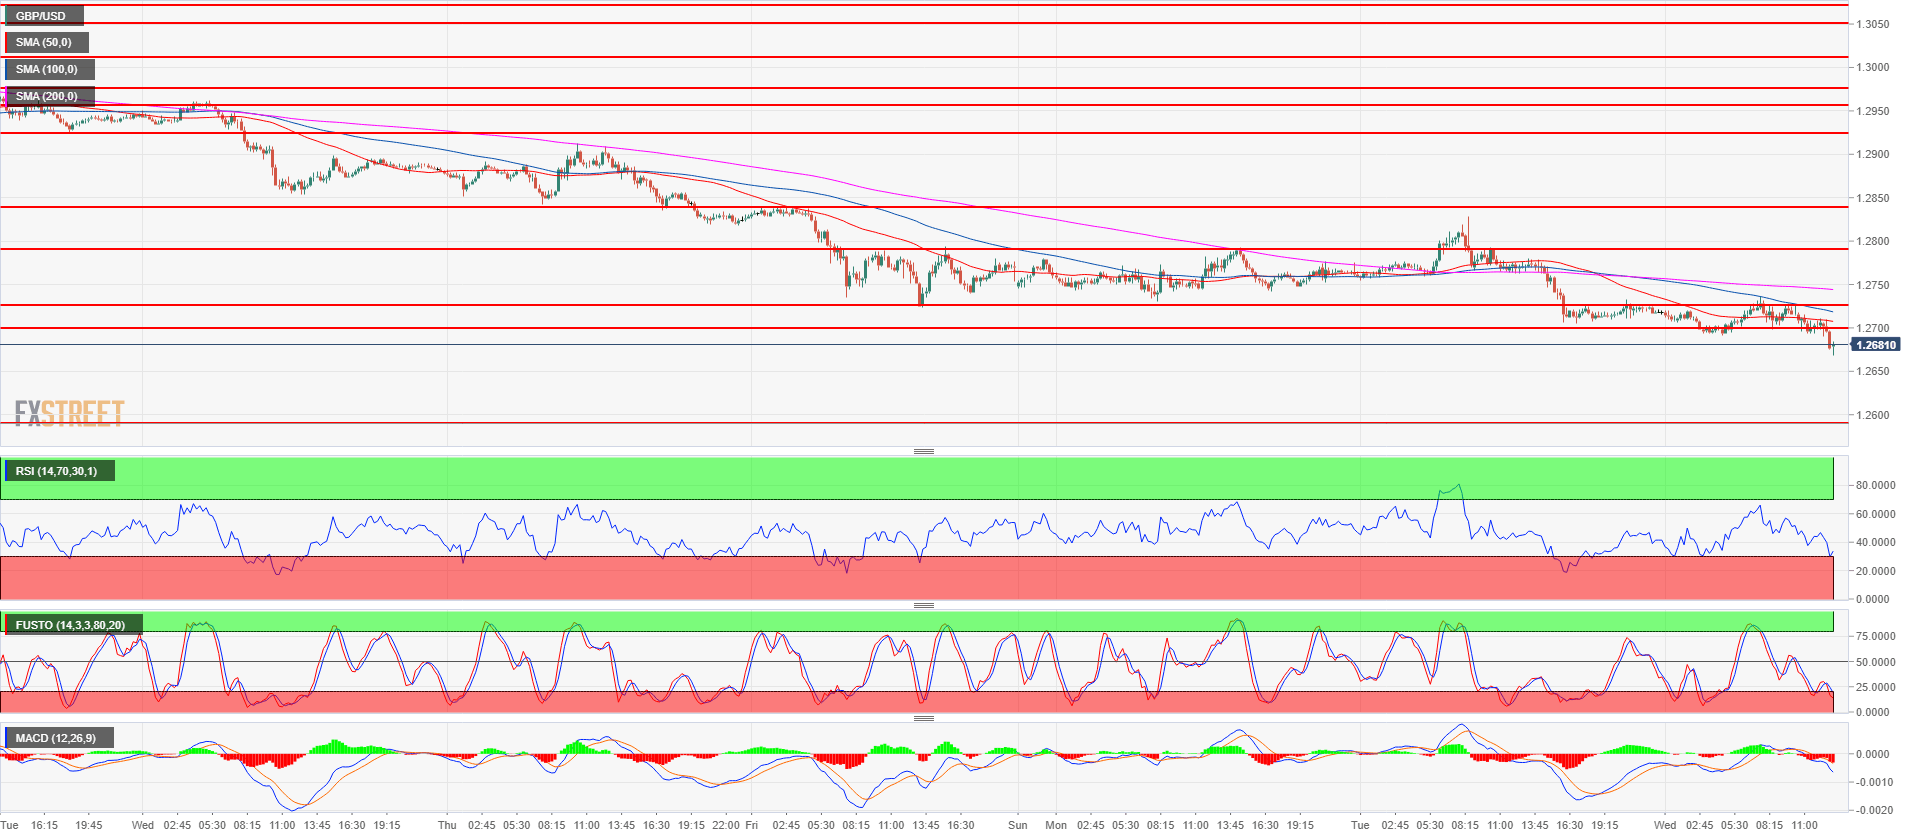
- GBP/USD bears show no mercy as Cable reached a new 2018 low below the 1.2700 figure. GBP/USD is trading below its 50, 100 and 200-period simple moving averages on the 15-minute chart suggesting a strong bearish bias as the market is down for the 12th day in a row.
- There seems to be little significant resistance before the next key support level at 1.2589 (June 21, 2017 low).
- Resistances to the upside are located near 1.2700 and 1.2723, August 10 low. Any rally will likely be met with selling pressure.
GBP/USD daily chart
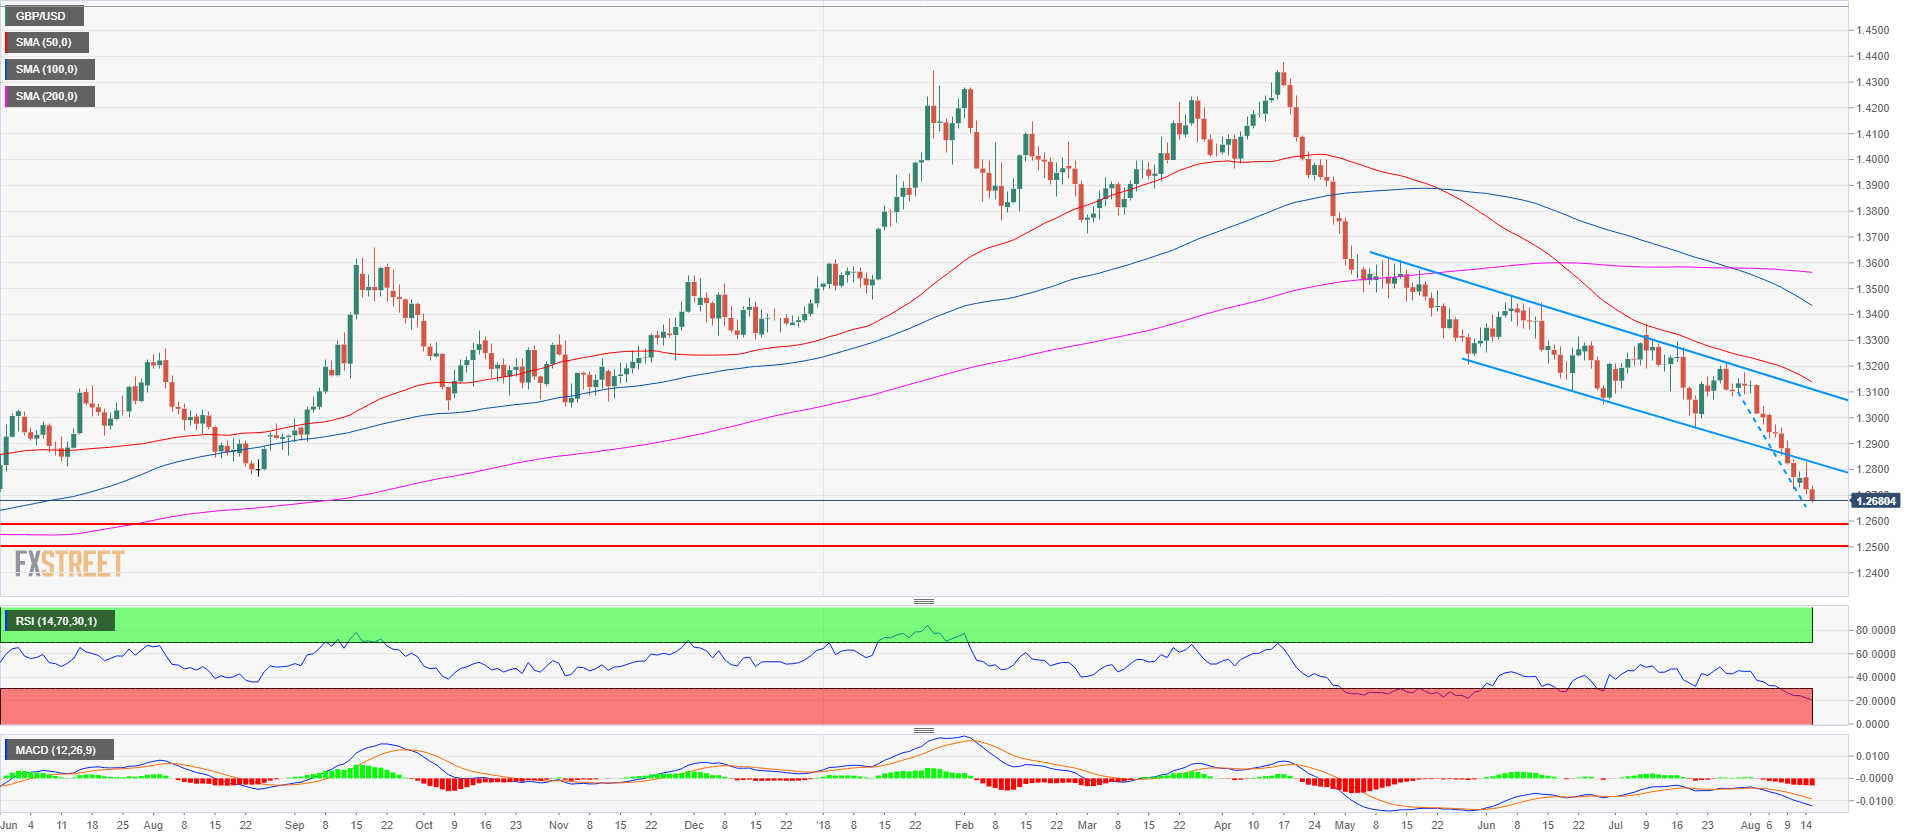
Spot rate: 1.2685
Relative change: -0.29%
High: 1.2736
Low: 1.2668
Trend: Bearish
Resistance 1: 1.2700 figure
Resistance 2: 1.2723, August 10 low
Resistance 3: 1.2789 intraday swing high
Resistance 4: 1.2838, August 10 high
Resistance 5: 1.2900-1.2923 area, figure and August 7 low
Support 1: 1.2589 June 21, 2017 low
Support 2: 1.2500 figure
Support 3: 1.2365 April 7, 2017
This article was originally published by Fxstreet.com. Read the original article here.