
Products You May Like
- AUD/JPY fails to extend medium-term trend-line breakout beyond 100-day EMA.
- Overbought conditions of RSI could push sellers for re-entry.
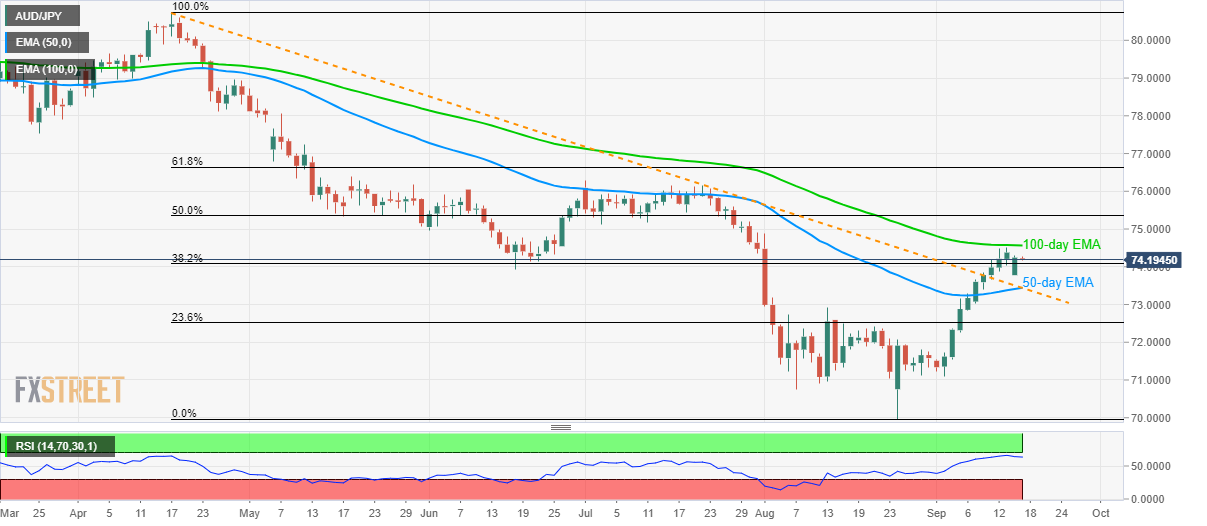
Despite breaking key medium-term resistances (now supports), AUD/JPY clings to 74.20 during early Asian morning on Tuesday.
The 100-day exponential moving average (EMA) restricts the quote’s upside, at 74.56 now, even after rising beyond five-month-old falling trend-line and 50-day EMA. Also supporting the case for a pullback is overbought conditions of 14-day relative strength index (RSI).
As a result, sellers will look to re-enter on a downside break below 73.45/40 confluence including resistance-turned-support line and 50-day EMA.
In doing so, 23.6% Fibonacci retracement of April-August declines near 72.50 will become their target.
Meanwhile, an upside clearance of 100-day EMA near 74.56, could escalate the pair’s run-up towards 75.00 whereas 50% Fibonacci retracement level of 75.36 will please bulls then after.
AUD/JPY daily chart
Trend: sideways