Products You May Like
- 21-HMA, 2-day old horizontal support limit the GBP/USD pair moves inside a short-term descending triangle.
- 100-HMA adds strength to the triangle resistance.
While descending triangle formation portrays the GBP/USD pair’s immediate moves, 21-hour moving average (21-HMA) offers an extra filter to the upside as the quote trades near 1.2670 ahead of the UK open on Friday.
Even if the pair crosses immediate HMA resistance of 1.2680, triangle’s upper-line and 100-HMA level around 1.2705/06 seems a tough nut to crack for buyers.
In a case prices rally beyond 1.2706, their run-up to latest high around 1.2785 can’t be denied.
On the downside break of 1.2660 horizontal-support, sellers can aim for 1.2642 and 61.8% Fibonacci retracement level of 1.2612.
During the pair’s extra south-run under 1.2612, 1.2600 and June 18 high around 1.2570 can entertain sellers.
GBP/USD hourly chart
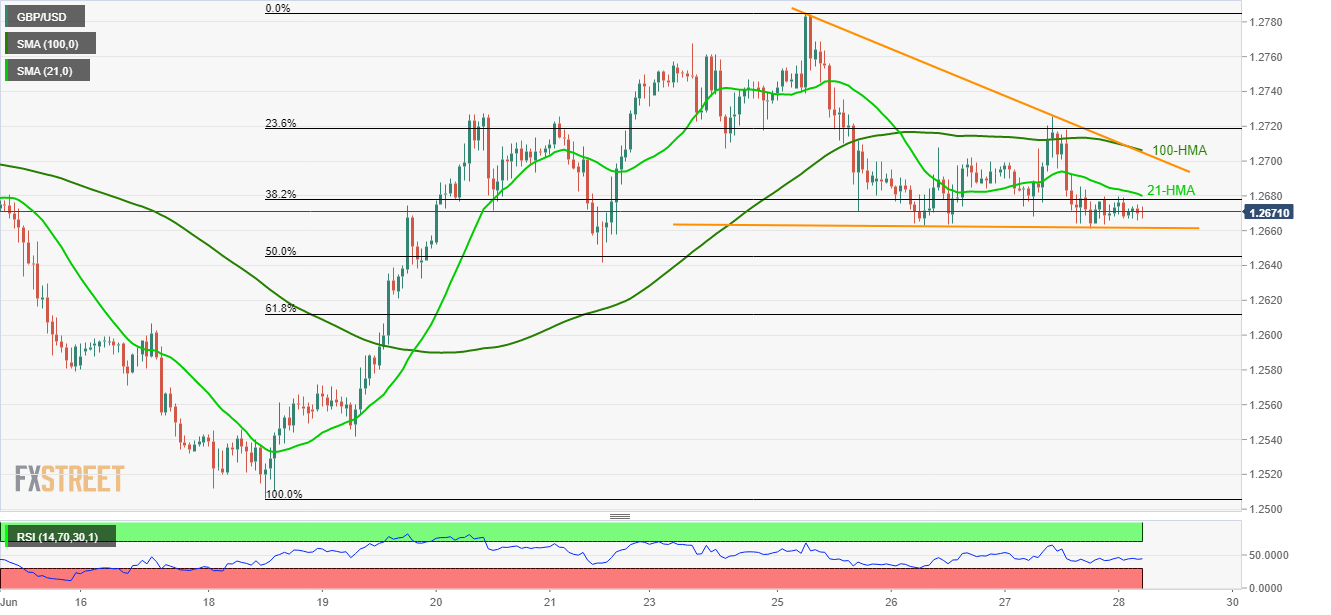
Trend: Sideways
This article was originally published by Fxstreet.com. Read the original article here.