
Products You May Like
Trading the News: China Manufacturing Purchasing Manager Index (PMI)
Updates to China’s Purchasing Managers Index (PMI) may keep AUD/USD under pressure ahead of the Reserve Bank of Australia (RBA) meeting on June 4 as the gauge is expected to indicate a contraction in manufacturing activity.
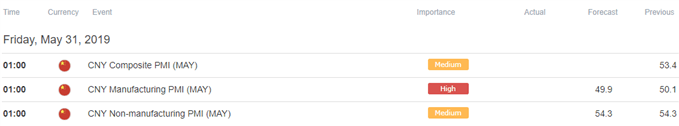
A PMI reading below 50 warns of a potential slowdown in the sector as business sentiment wanes, and the weakening outlook for the Asia/Pacific region may produce headwinds for the Australian dollar as it puts pressure on the Reserve Bank of Australia to further insulate the economy.
In turn, a print of 49.9 may generate a bearish reaction in AUD/USD as it fuels bets for an imminent RBA rate-cut, and Governor Philip Lowe & Co. may continue to strike a dovish tone in the second half of 2019 as the U.S. China, Australia’s largest trading partner, struggle to reach a trade deal.
In contrast, an above-forecast PMI print may keep AUD/USD in its current range as it encourages the RBA to retain a wait-and-see approach for monetary policy.
Impact that China’s PMI had on AUD/USD during the previous release
|
Period |
Data Released |
Estimate |
Actual |
Pips Change (1 Hour post event ) |
Pips Change (End of Day post event) |
|
APR 2019 |
04/30/2019 01:00:00 GMT |
50.5 |
50.1 |
-21 |
-20 |
April 2019China Manufacturing Purchasing Manager Index (PMI)
AUD/USD 5-Minute Chart

China’s Manufacturing Purchasing Managers Index (PMI) unexpectedly narrowed to 50.1 from 50.5 in March, with gauge for service-based activity highlighting a similar dynamic as the figure slipped to 54.3 from 54.8 during the same period. As a result, the Composite PMI fell to 53.4 in April from 54.0 the month prior.
The Australian dollar struggled to hold its ground amid the weakening outlook for the Asia/Pacific region, with quickly pulling back from a high of 0.7069 to close the day at 0.7047. Learn more with the DailyFX Advanced Guide for Trading the News.
AUD/USD Rate Daily Chart
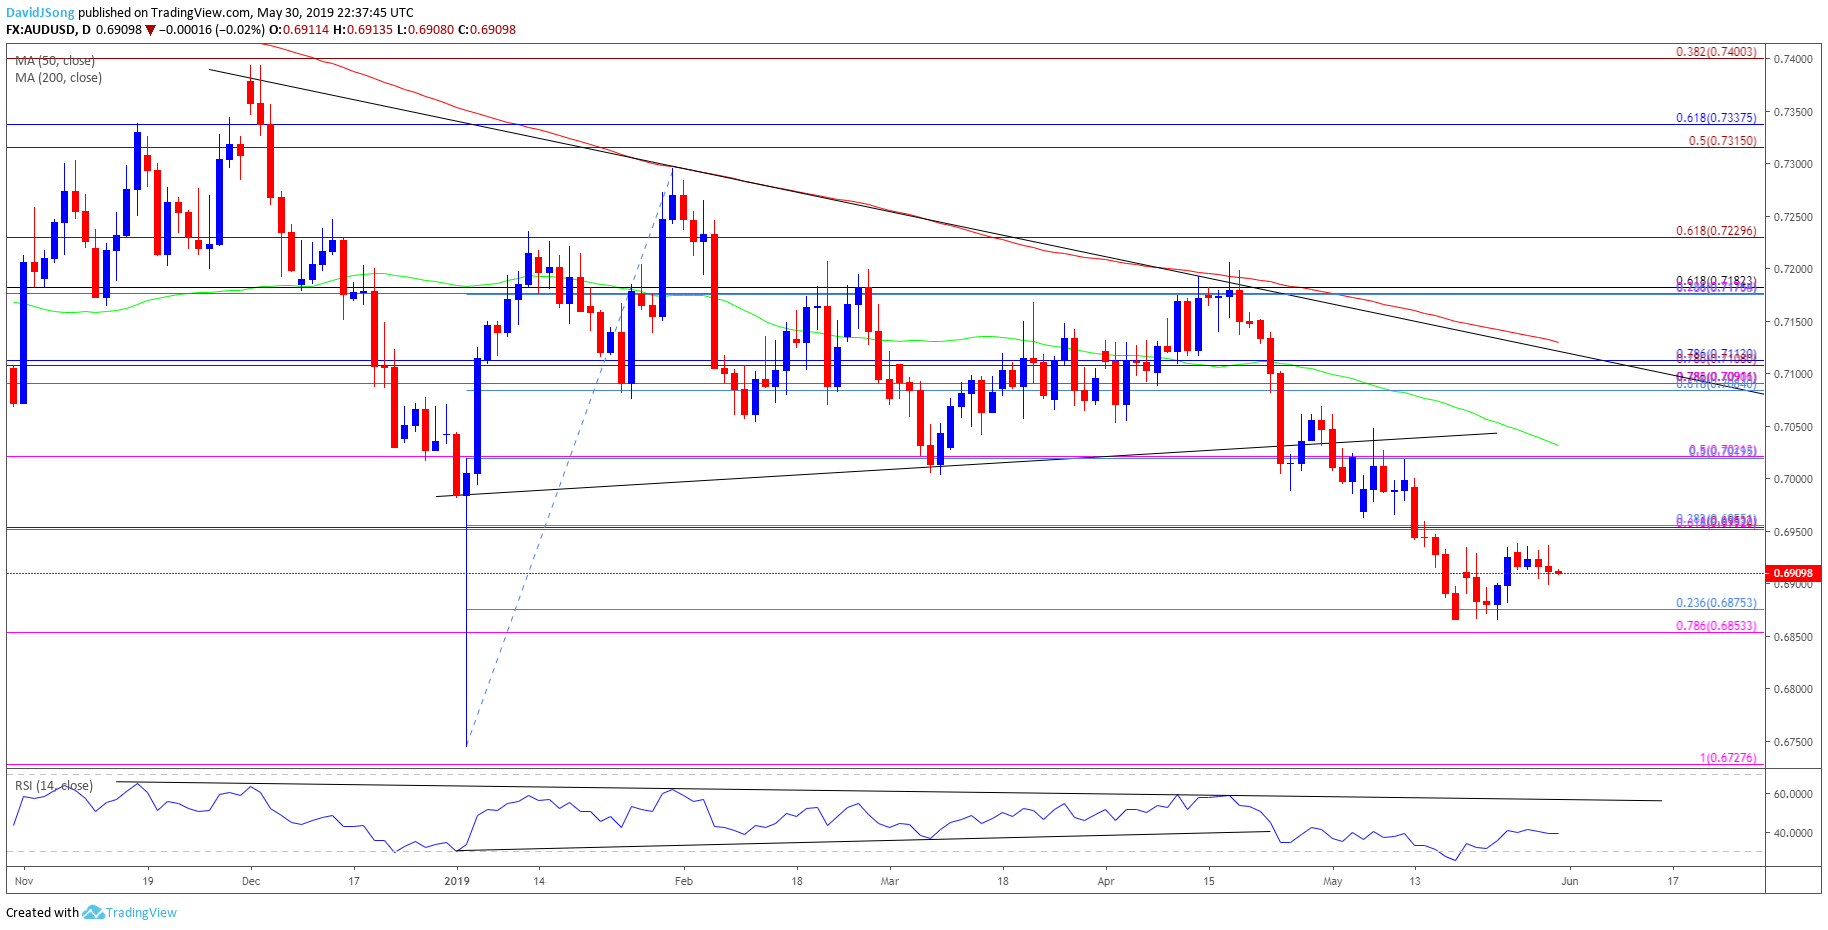
- Keep in mind, the AUD/USD rebound following the currency market flash-crash has been capped by the 200-Day SMA (0.7130), with the exchange rate marking another failed attempt to break/close above the moving average in April.
- In turn, AUD/USD remains at risk of giving back the rebound from the 2019-low (0.6745) as the wedge/triangle formation in both price and the Relative Strength Index (RSI) unravels, with the Fibonacci overlap around 0.6850 (78.6% expansion) to 0.6880 (23.6% retracement) still on the radar the exchange rate struggles to push back above the 0.6950 (61.8% expansion) pivot.
- Next downside hurdle comes in around 0.6730 (100% expansion), but will keep a close eye on the RSI as the oscillator bounces back from oversold territory, with the development raising the risk for a larger rebound in the aussie-dollar exchange rate.
Additional Trading Resources
New to the currency market? Want a better understanding of the different approaches for trading? Start by downloading and reviewing the DailyFX Beginners Guide.
Are you looking to improve your trading approach? Review the ‘Traits of a Successful Trader’ series on how to effectively use leverage along with other best practices that any trader can follow.
— Written by David Song, Currency Strategist
Follow me on Twitter at @DavidJSong.